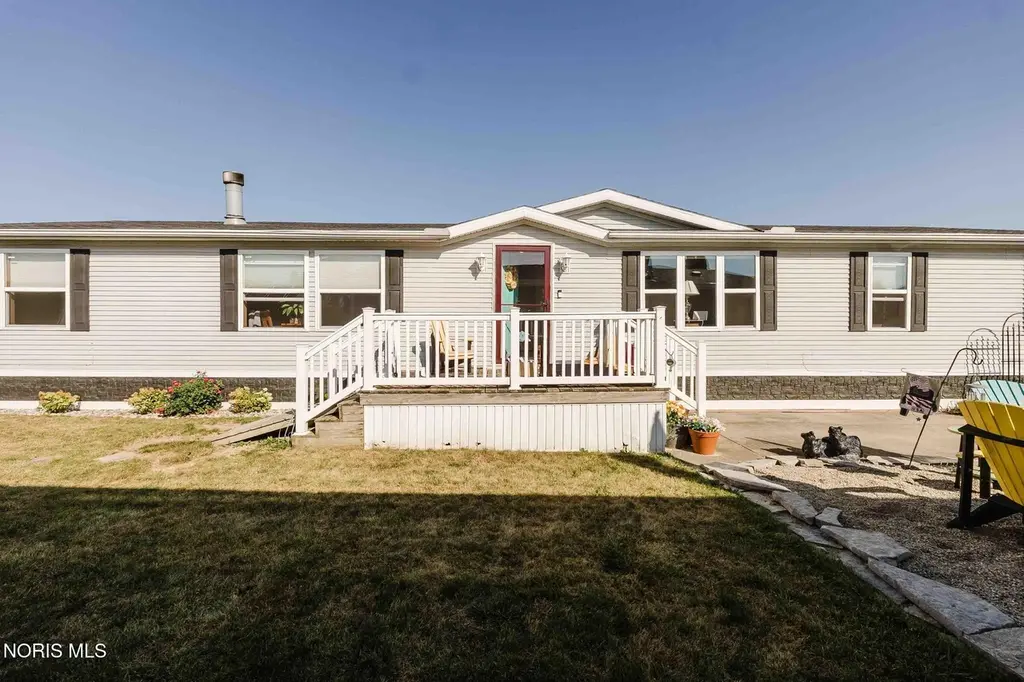
1736 Woodridge
Findlay, OH 45840
$109,900B
0 bd · 2.0 ba ·
1,836 sqft ·
Built 2000
· Manufactured
· Active
· 23 DOM
Cashflow @ list (25.0% down · 7.5%)
Estimated rent
$1,354/mo
Mortgage (P&I)
−$576
Tax + insurance
−$69
HOA
−$0
Vac / Maint / Mgmt
−$284
Net cashflow
$425/mo
Annual
$5,097/yr
Cap rate
10.93%
Cash-on-cash
16.56%
DSCR
1.74
1% rule
1.23%
Cash to close
$30,772
Investor read
- This is a ?-bed/2.0-bath manufactured listed at $110k.
- At list price, monthly cash flow is $425 ($5k/yr) — positive.
- The deal already cash-flows at list — no discount required.
- Meets the 1% rule at list price ($1k rent vs $110k).
- It's been on market 23 days — a 2% lower offer ($108k) is reasonable based on typical stale-listing flexibility.
- Recommended offer: $108k (1.5% below list) — sets the bar for market timing.
- Local home prices are declining (-3.0%/yr); year-one equity from $760 of loan paydown is wiped out by about $3k of value loss. Plan a longer hold.
- Location reads 81/100 on livability (#98 in OH, #1,496 nationally) — a professional / high-income tenant draw. Strengths: amenities A+, cost of living A+, housing A+; Watch: employment D+, commute F.
- Findlay City (town): math 56% / reading 56% proficiency, ranked #357 of 656 in OH (top 54%) — acceptable for families but not a draw, mixed tenant base, ~2y average lease.
- Zoned schools: Jefferson Primary School (393 students, 34% FRL); Glenwood Middle School (math 47% / reading 41%, grade D, #484 of 654 statewide, top 74%, 535 students, 45% FRL); Findlay High School (math 51% / reading 60%, grade C, #296 of 781 statewide, top 39%, 1,915 students, 31% FRL) — zoned schools at 37% FRL track the district average.
- Market conditions: Rents rising fast (+5.7%/yr); 219 active listings in the ZIP; 1 comparable units currently listed for rent nearby; 257 units permitted in Hancock County in 2024 (150 in 5+ unit buildings).
- Hancock County population projected to shrink 4% by 2050 — rents likely to lag national; underwrite the cash flow, not the appreciation.
- 6 sale attempts since 9y ago with the ask held roughly flat each time — persistent listings suggest the price (not the market) is what's stuck; bring a comps-based counter.
- Current owner paid $57k; list at $110k implies a 93% gain — meaningful room to come down on a strong offer.
- At projected returns (-3.0% appreciation + 5.7% rent growth), your $31k cash investment doubles in ~7 years — after that, you're playing with house money.
- Cap rate 10.9% vs local median 5.0% in Findlay — top-decile yield for the area; either an underpriced asset or a hidden risk that comps aren't pricing in. Stress-test before assuming the spread holds.
Questions for listing agent
- Is there a deadline driving the sale (1031 exchange, divorce, estate, relocation)? That informs how much negotiation room exists.
- Schools are B-rated — typically a magnet for longer-tenancy family renters. What's the average tenant stay here, and is there a school-zone premium baked into asking?
- What's the average days-on-market for RENTAL listings here right now (not sales)? A rising rental-DOM trend means longer vacancies and softer asking-rent achievability than the comps imply.
- What's the recent tenant-quality profile in this submarket — average credit score on applications, eviction rate, late-payment / NSF rate, and stable-employment percentage? A property-management company in the area should have these aggregated.
- How much new for-sale + rental construction is in the pipeline within 1–3 miles? Heavy new supply typically softens prices + rents 12–24 months out; constrained supply supports both.
CashFlowRE · CFR-X14Y037JSYR24P
· Data 1 day ago
cashflowre.app · 2026-05-29