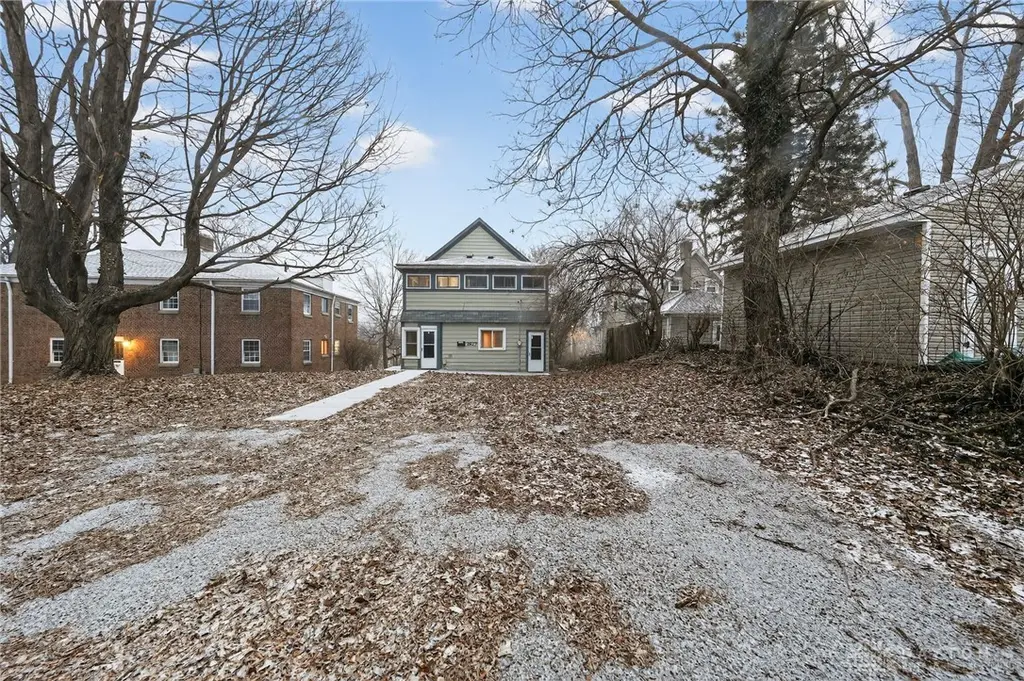
2527 S Dixie Dr
Kettering, OH 45409
$139,900A-
4 bd · 2.0 ba ·
1,632 sqft ·
Built 1910
· MultiFamily
· Pending
· 112 DOM
Cashflow @ list (25.0% down · 7.5%)
Estimated rent
$2,376/mo
Mortgage (P&I)
−$734
Tax + insurance
−$250
HOA
−$0
Vac / Maint / Mgmt
−$499
Net cashflow
$894/mo
Annual
$10,725/yr
Cap rate
13.96%
Cash-on-cash
27.38%
DSCR
2.22
1% rule
1.70%
Cash to close
$39,172
Investor read
- This is a 4-bed/2.0-bath multifamily listed at $140k.
- At list price, monthly cash flow is $894 ($11k/yr) — positive.
- The deal already cash-flows at list — no discount required.
- Meets the 1% rule at list price ($2k rent vs $140k).
- It's been on market 112 days — a 9% lower offer ($127k) is reasonable based on typical stale-listing flexibility.
- Recommended offer: $127k (9.0% below list) — sets the bar for market timing.
- Local home prices are declining (-3.0%/yr); year-one equity from $967 of loan paydown is wiped out by about $4k of value loss. Plan a longer hold.
- Location reads 83/100 on livability (#61 in OH, #922 nationally) — a professional / high-income tenant draw. Strengths: schools A+, crime A+, cost of living A+; Watch: commute F.
- Kettering City School District (suburban): math 54% / reading 68% proficiency, ranked #277 of 656 in OH (top 42%) — acceptable for families but not a draw, mixed tenant base, ~2y average lease.
- Watch-outs: built in 1910 — expect roof / HVAC / electrical / plumbing capex.
- Market conditions: Rents rising fast (+10.8%/yr); 53 active listings in the ZIP; 2 comparable units currently listed for rent nearby; solid renter incomes; 907 units permitted in Montgomery County in 2024 (416 in 5+ unit buildings).
- Montgomery County population projected at -10% by 2050 — secular population decline; favor cash flow + early exit over multi-decade hold.
- 5 sale attempts since 15y ago; this cycle's ask has dropped $45k (24%) from the opening price — seller is motivated, your offer sets the floor, not the list.
- Current owner paid $36k; list at $140k implies a 289% gain — meaningful room to come down on a strong offer.
- At projected returns (-3.0% appreciation + 8.0% rent growth), your $39k cash investment doubles in ~4 years — after that, you're playing with house money.
- Cap rate 14.0% vs local median 4.4% in Kettering — top-decile yield for the area; either an underpriced asset or a hidden risk that comps aren't pricing in. Stress-test before assuming the spread holds.
- This rent runs 33% of the median local income ($87k/yr) — at the standard rent-burdened threshold; future hikes will face affordability resistance.
Questions for listing agent
- It's been on market 112 days. Have you received any prior offers? Is the seller open to a 9% concession, seller financing, or rate buy-down credit?
- Built in 1910 — when were the roof, HVAC, electrical panel, plumbing, and water heater last replaced?
- Why hasn't it sold? Are there any deal-killer items the seller is aware of (foundation, flood, title, zoning, code violations)?
- Is there a deadline driving the sale (1031 exchange, divorce, estate, relocation)? That informs how much negotiation room exists.
- Schools are A-rated — typically a magnet for longer-tenancy family renters. What's the average tenant stay here, and is there a school-zone premium baked into asking?
- What's the average days-on-market for RENTAL listings here right now (not sales)? A rising rental-DOM trend means longer vacancies and softer asking-rent achievability than the comps imply.
- What's the recent tenant-quality profile in this submarket — average credit score on applications, eviction rate, late-payment / NSF rate, and stable-employment percentage? A property-management company in the area should have these aggregated.
- How much new apartment / multifamily construction is in the pipeline within 1–3 miles? Heavy new supply (>2% of stock underway) typically softens rents 12–24 months out; light construction supports rent growth.
CashFlowRE · CFR-X177AP1CXC0GHD
· Data 6 days ago
cashflowre.app · 2026-05-29