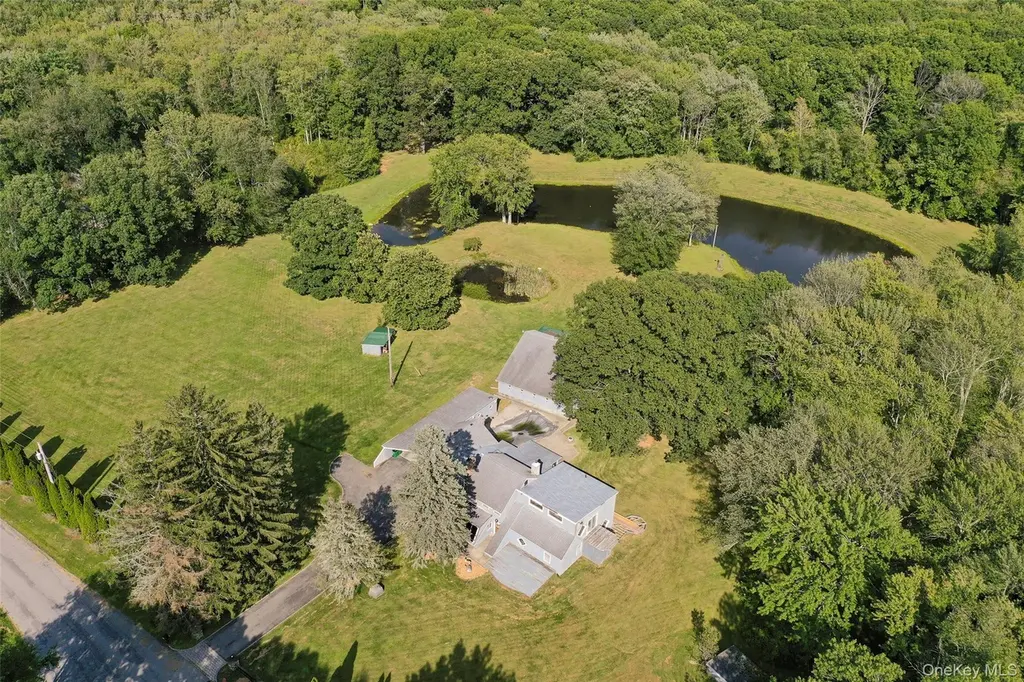
89 Deer Pond Rd
Millbrook, NY 12585
$575,000D
4 bd · 1.5 ba ·
2,112 sqft ·
Built 1960
· SingleFamily
· Active
· 164 DOM
Cashflow @ list (25.0% down · 7.5%)
Estimated rent
$3,134/mo
Mortgage (P&I)
−$3,015
Tax + insurance
−$949
HOA
−$0
Vac / Maint / Mgmt
−$658
Net cashflow
$-1,488/mo
Annual
$-17,854/yr
Cap rate
3.19%
Cash-on-cash
-11.09%
DSCR
0.51
1% rule
0.55%
Cash to close
$161,000
Investor read
- This is a 4-bed/1.5-bath single-family listed at $575k.
- At list price, monthly cash flow is $-1k ($-18k/yr) — negative.
- To cash-flow at today's rent, offer at most $312k (45.7% below list).
- To meet the 1% rule (rent ≥ 1% of price), the offer needs to be $313k (45.5% below list).
- It's been on market 164 days — a 12% lower offer ($506k) is reasonable based on typical stale-listing flexibility.
- Recommended offer: $312k (45.7% below list) — sets the bar for cash-flow.
- In year one you build about $31k of equity ($4k loan paydown + $27k appreciation (4.7% local appreciation)).
- Location reads 68/100 on livability (#524 in NY) — a middle-class / working-renter tenant base. Strengths: crime A+, employment A; Watch: amenities F, commute F, cost of living F.
- Millbrook Central School District (rural): math 65% / reading 63% proficiency, ranked #198 of 755 in NY (top 26%) — acceptable for families but not a draw, mixed tenant base, ~2y average lease; only 17% free/reduced lunch — higher-income household profile.
- Zoned schools: Elm Drive Elementary School (192 students, 22% FRL); Millbrook Middle School (math 42% / reading 67%, grade B-, #214 of 729 statewide, top 31%, 202 students, 37% FRL); Millbrook High School (math 87%, 271 students, 34% FRL).
- Market conditions: 9 active listings in the ZIP; 620 units permitted in Dutchess County in 2024 (242 in 5+ unit buildings).
- Dutchess County population projected at -11% by 2050 — secular population decline; favor cash flow + early exit over multi-decade hold.
- 3 sale attempts with the ask held roughly flat each time — persistent listings suggest the price (not the market) is what's stuck; bring a comps-based counter.
- By year 2, paydown + projected appreciation supports a ~$49k cash-out refi (75% LTV) — recoverable capital for the next deal without selling this one.
- Climate carrying-cost: major wildfire risk — expect insurance premiums to compound above CPI over the hold.
- Cap rate 3.2% vs local median 2.0% in Millbrook — top-decile yield for the area; either an underpriced asset or a hidden risk that comps aren't pricing in. Stress-test before assuming the spread holds.
Questions for listing agent
- What do current leases actually rent for vs. the listed asking? Can we see a recent rent roll and the last 12 months of T-12 income?
- It's been on market 164 days. Have you received any prior offers? Is the seller open to a 46% concession, seller financing, or rate buy-down credit?
- Built in 1960 — when were the roof, HVAC, electrical panel, plumbing, and water heater last replaced?
- Why hasn't it sold? Are there any deal-killer items the seller is aware of (foundation, flood, title, zoning, code violations)?
- Is there a deadline driving the sale (1031 exchange, divorce, estate, relocation)? That informs how much negotiation room exists.
- Schools are A-rated — typically a magnet for longer-tenancy family renters. What's the average tenant stay here, and is there a school-zone premium baked into asking?
- The area grade is low — what's the realistic commute time and amenity access for the typical tenant pool here? Any planned neighborhood developments (good or bad) we should know about?
- What's the average days-on-market for RENTAL listings here right now (not sales)? A rising rental-DOM trend means longer vacancies and softer asking-rent achievability than the comps imply.
CashFlowRE · CFR-X1RC0GBMR3ZMRG
· Data 14 h ago
cashflowre.app · 2026-05-29