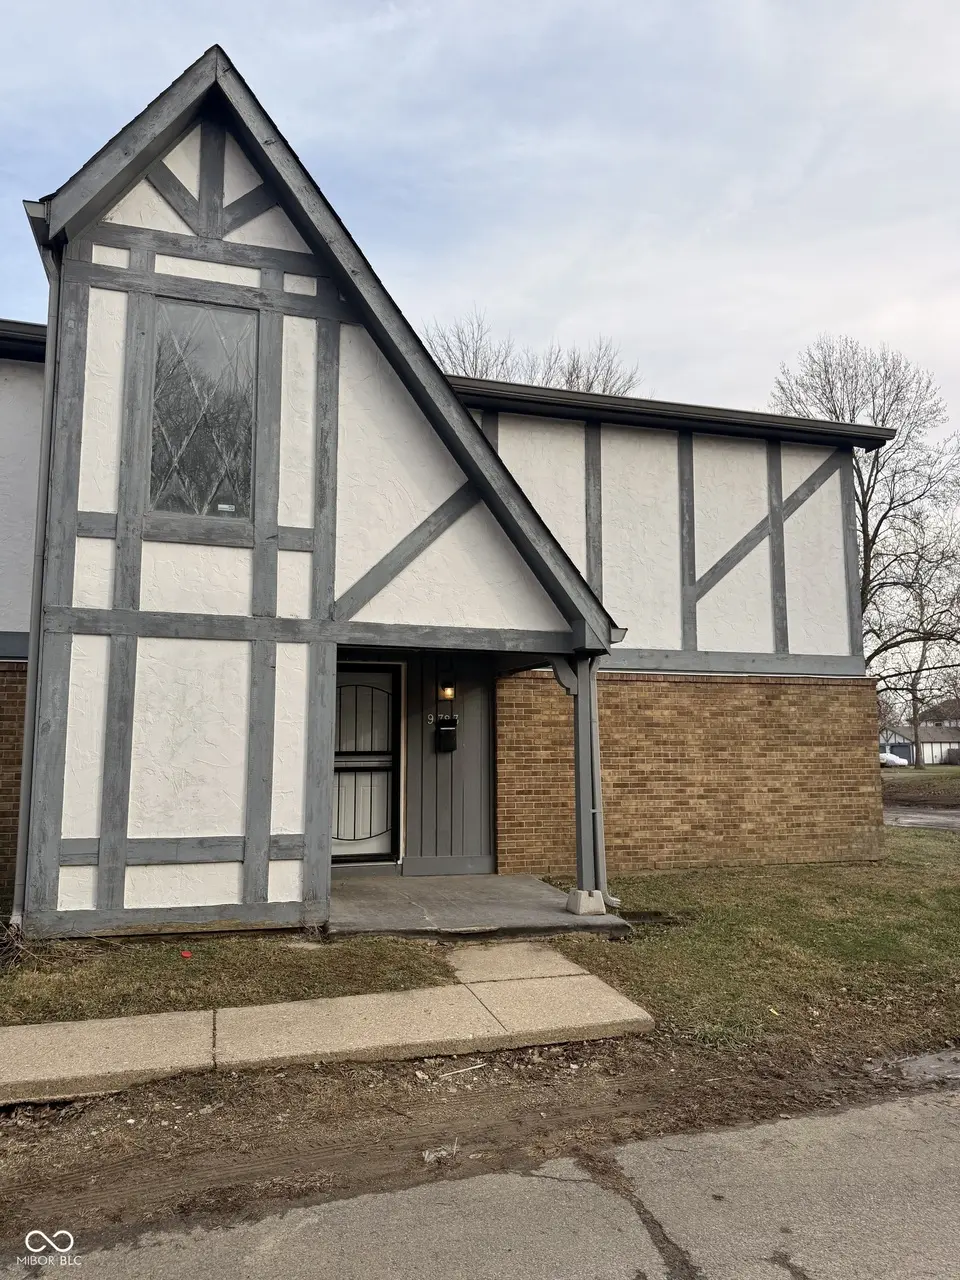
9783 Kingscross Ct
Indianapolis city (balance), IN 46235
$45,000B-
2 bd · 1.0 ba ·
2,000 sqft ·
Built 1973
· Condo
· Pending
· 126 DOM
Cashflow @ list (25.0% down · 7.5%)
Estimated rent
$1,630/mo
Mortgage (P&I)
−$236
Tax + insurance
−$140
HOA
−$250
Vac / Maint / Mgmt
−$342
Net cashflow
$662/mo
Annual
$7,944/yr
Cap rate
23.95%
Cash-on-cash
63.05%
DSCR
3.81
1% rule
3.62%
Cash to close
$12,600
Investor read
- This is a 2-bed/1.0-bath condo listed at $45k.
- At list price, monthly cash flow is $662 ($8k/yr) — positive.
- The deal already cash-flows at list — no discount required.
- Meets the 1% rule at list price ($2k rent vs $45k).
- It's been on market 126 days — a 12% lower offer ($40k) is reasonable based on typical stale-listing flexibility.
- Recommended offer: $40k (12.0% below list) — sets the bar for market timing.
- Local home prices are declining (-3.0%/yr); year-one equity from $311 of loan paydown is wiped out by about $1k of value loss. Plan a longer hold.
- Location reads: area grade B — affects rentability + tenant quality, not the cash-flow math above.
- Indianapolis Public Schools (urban): math 14% / reading 20% proficiency, ranked #286 of 301 in IN (top 95%) — low school quality limits family demand, transient renter base, plan for 1-2y turnover; 77% free/reduced lunch — lower-income household profile, screen leases tightly.
- Watch-outs: property tax is 3.2% of price.
- Market conditions: Rents rising (+2.6%/yr); 54 active listings in the ZIP; 5 comparable units currently listed for rent nearby; rentals at typical pace (median 17d on market — plan ~3-4 weeks tenant-placement turnaround); 1,906 units permitted in Marion County in 2024 (621 in 5+ unit buildings).
- Marion County population projected at +18% by 2050 — long-run rental-demand tailwind backs the buy-and-hold thesis.
- 4 sale attempts since 3y ago; this cycle's ask has dropped $35k (44%) from the opening price — seller is motivated, your offer sets the floor, not the list.
- At projected returns (-3.0% appreciation + 2.6% rent growth), your $13k cash investment doubles in ~2 years — after that, you're playing with house money.
- Cap rate 23.9% vs local median 4.4% in Indianapolis city (balance) — top-decile yield for the area; either an underpriced asset or a hidden risk that comps aren't pricing in. Stress-test before assuming the spread holds.
- This rent runs 33% of the median local income ($59k/yr) — at the standard rent-burdened threshold; future hikes will face affordability resistance.
Questions for listing agent
- It's been on market 126 days. Have you received any prior offers? Is the seller open to a 12% concession, seller financing, or rate buy-down credit?
- Built in 1973 — when were the roof, HVAC, electrical panel, plumbing, and water heater last replaced?
- Property tax is high relative to price — has the assessment been appealed recently, and will the sale trigger a re-assessment?
- What does the HOA fee cover, when was the last increase, and are there any pending special assessments or reserve-fund shortfalls?
- Any open or pending special assessments — roof, HVAC, plumbing, elevator, façade? What's the per-unit balance and payoff schedule, and is the seller paying it off at close or rolling it to the buyer?
- Why hasn't it sold? Are there any deal-killer items the seller is aware of (foundation, flood, title, zoning, code violations)?
- Is there a deadline driving the sale (1031 exchange, divorce, estate, relocation)? That informs how much negotiation room exists.
- What's the average days-on-market for RENTAL listings here right now (not sales)? A rising rental-DOM trend means longer vacancies and softer asking-rent achievability than the comps imply.
CashFlowRE · CFR-X2K09B94FZN0CB
· Data 1 week ago
cashflowre.app · 2026-05-29