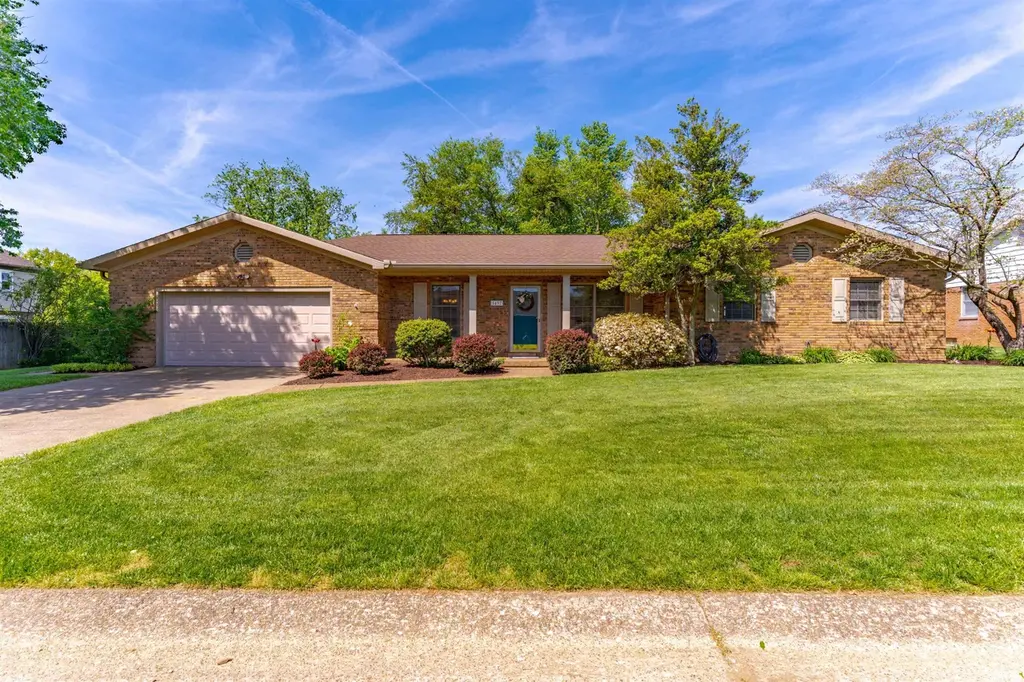
5497 E Sherwood Dr
Newburgh, IN 47630
$289,500D-
3 bd · 1.5 ba ·
2,046 sqft ·
Built 1981
· SingleFamily
· Pending
· 1 DOM
Cashflow @ list (25.0% down · 7.5%)
Estimated rent
$2,070/mo
Mortgage (P&I)
−$1,518
Tax + insurance
−$252
HOA
−$0
Vac / Maint / Mgmt
−$435
Net cashflow
$-135/mo
Annual
$-1,621/yr
Cap rate
5.73%
Cash-on-cash
-2.00%
DSCR
0.91
1% rule
0.72%
Cash to close
$81,060
Investor read
- This is a 3-bed/1.5-bath single-family listed at $290k.
- At list price, monthly cash flow is $-135 ($-2k/yr) — negative.
- To cash-flow at today's rent, offer at most $266k (8.2% below list).
- To meet the 1% rule (rent ≥ 1% of price), the offer needs to be $207k (28.5% below list).
- Only 1 days on market — expect competitive offers; lowballing is unlikely to land.
- Recommended offer: $207k (28.5% below list) — sets the bar for 1% rule.
- Local home prices are declining (-3.0%/yr); year-one equity from $2k of loan paydown is wiped out by about $9k of value loss. Plan a longer hold.
- Location reads 80/100 on livability (#21 in IN, #1,922 nationally) — a professional / high-income tenant draw. Strengths: crime A+, cost of living A+, housing A+; Watch: amenities F, commute F.
- Warrick County School Corporation (suburban): math 54% / reading 59% proficiency, ranked #24 of 301 in IN (top 8%) — acceptable for families but not a draw, mixed tenant base, ~2y average lease.
- Zoned schools: Sharon Elementary School (math 65% / reading 62%, grade B, #95 of 994 statewide, top 10%, 686 students, 45% FRL); Castle South Middle School (math 43% / reading 57%, grade C, #48 of 330 statewide, top 15%, 712 students, 34% FRL); Castle High School (math 56% / reading 80%, grade B, #22 of 369 statewide, top 6%, 1,961 students, 26% FRL).
- Market conditions: Rents rising fast (+8.7%/yr); 395 active listings in the ZIP; 8 comparable units currently listed for rent nearby; rentals at typical pace (median 23d on market — plan ~3-4 weeks tenant-placement turnaround); solid renter incomes; 249 units permitted in Warrick County in 2024 (0 in 5+ unit buildings).
- Warrick County population projected at +9% by 2050 — modest demand growth; plan on rents tracking national, not racing it.
- Climate carrying-cost: extreme-heat days projected 7→19/yr by 2055 (HVAC capex compounding) — expect insurance premiums to compound above CPI over the hold.
- Cap rate 5.7% vs local median 3.9% in Newburgh — top-decile yield for the area; either an underpriced asset or a hidden risk that comps aren't pricing in. Stress-test before assuming the spread holds.
Questions for listing agent
- What do current leases actually rent for vs. the listed asking? Can we see a recent rent roll and the last 12 months of T-12 income?
- Is there a deadline driving the sale (1031 exchange, divorce, estate, relocation)? That informs how much negotiation room exists.
- Schools are A-rated — typically a magnet for longer-tenancy family renters. What's the average tenant stay here, and is there a school-zone premium baked into asking?
- The area grade is low — what's the realistic commute time and amenity access for the typical tenant pool here? Any planned neighborhood developments (good or bad) we should know about?
- What's the average days-on-market for RENTAL listings here right now (not sales)? A rising rental-DOM trend means longer vacancies and softer asking-rent achievability than the comps imply.
- What's the recent tenant-quality profile in this submarket — average credit score on applications, eviction rate, late-payment / NSF rate, and stable-employment percentage? A property-management company in the area should have these aggregated.
- How much new for-sale + rental construction is in the pipeline within 1–3 miles? Heavy new supply typically softens prices + rents 12–24 months out; constrained supply supports both.
CashFlowRE · CFR-X4EEZ31E2XMDD7
· Data 4 weeks ago
cashflowre.app · 2026-05-29