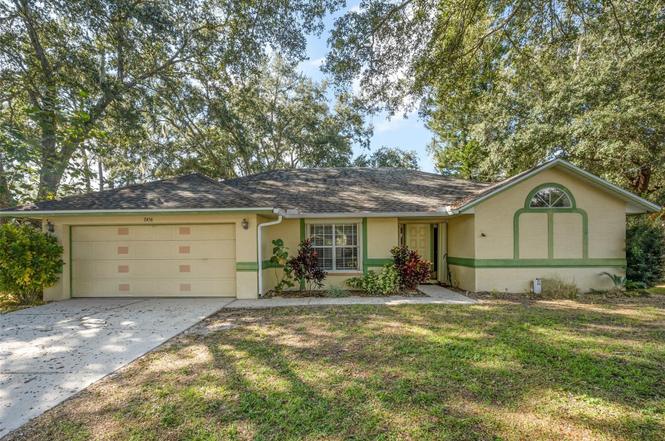
7456 Camio Ave
Port St. John, FL 32927
$295,000D
3 bd · 2.0 ba ·
1,582 sqft ·
Built 1989
· SingleFamily
· Active
· 191 DOM
Cashflow @ list (25.0% down · 7.5%)
Estimated rent
$2,488/mo
Mortgage (P&I)
−$1,547
Tax + insurance
−$452
HOA
−$0
Vac / Maint / Mgmt
−$522
Net cashflow
$-33/mo
Annual
$-401/yr
Cap rate
6.16%
Cash-on-cash
-0.49%
DSCR
0.98
1% rule
0.84%
Cash to close
$82,600
Investor read
- This is a 3-bed/2.0-bath single-family listed at $295k.
- At list price, monthly cash flow is $-33 ($-401/yr) — negative.
- To cash-flow at today's rent, offer at most $289k (2.0% below list).
- To meet the 1% rule (rent ≥ 1% of price), the offer needs to be $249k (15.7% below list).
- It's been on market 191 days — a 12% lower offer ($260k) is reasonable based on typical stale-listing flexibility.
- Recommended offer: $249k (15.7% below list) — sets the bar for 1% rule.
- Local home prices are declining (-3.0%/yr); year-one equity from $2k of loan paydown is wiped out by about $9k of value loss. Plan a longer hold.
- Location reads: area grade D — affects rentability + tenant quality, not the cash-flow math above.
- Brevard (suburban): math 53% / reading 57% proficiency, ranked #19 of 73 in FL (top 26%) — acceptable for families but not a draw, mixed tenant base, ~2y average lease.
- Market conditions: Rents rising (+2.5%/yr); 224 active listings in the ZIP; 5 comparable units currently listed for rent nearby; rentals at typical pace (median 24d on market — plan ~3-4 weeks tenant-placement turnaround); solid renter incomes; 4,602 units permitted in Brevard County in 2024 (702 in 5+ unit buildings).
- Brevard County population projected at +15% by 2050 — modest demand growth; plan on rents tracking national, not racing it.
- 2 sale attempts; this cycle's ask has dropped $50k (14%) from the opening price — seller is motivated, your offer sets the floor, not the list.
- Climate carrying-cost: severe wind risk, 99% chance of damaging wind over 30y; extreme-heat days projected 7→21/yr by 2055 (HVAC capex compounding) — expect insurance premiums to compound above CPI over the hold.
- This rent runs 35% of the median local income ($86k/yr) — at the standard rent-burdened threshold; future hikes will face affordability resistance.
Questions for listing agent
- What do current leases actually rent for vs. the listed asking? Can we see a recent rent roll and the last 12 months of T-12 income?
- It's been on market 191 days. Have you received any prior offers? Is the seller open to a 16% concession, seller financing, or rate buy-down credit?
- Why hasn't it sold? Are there any deal-killer items the seller is aware of (foundation, flood, title, zoning, code violations)?
- Is there a deadline driving the sale (1031 exchange, divorce, estate, relocation)? That informs how much negotiation room exists.
- The area grade is low — what's the realistic commute time and amenity access for the typical tenant pool here? Any planned neighborhood developments (good or bad) we should know about?
- What's the average days-on-market for RENTAL listings here right now (not sales)? A rising rental-DOM trend means longer vacancies and softer asking-rent achievability than the comps imply.
- What's the recent tenant-quality profile in this submarket — average credit score on applications, eviction rate, late-payment / NSF rate, and stable-employment percentage? A property-management company in the area should have these aggregated.
- How much new for-sale + rental construction is in the pipeline within 1–3 miles? Heavy new supply typically softens prices + rents 12–24 months out; constrained supply supports both.
CashFlowRE · CFR-X4RWC8530NW4WM
· Data 2 days ago
cashflowre.app · 2026-05-29