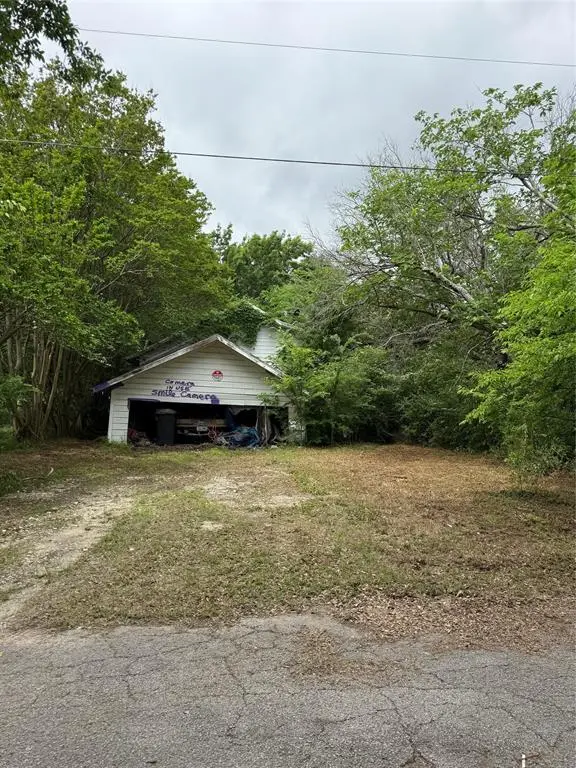
10180 Torama
West Tawakoni, TX 75169
$35,000D
2 bd · 2.0 ba ·
1,360 sqft ·
Built 1970
· SingleFamily
· Pending
· 5 DOM
Cashflow @ list (25.0% down · 7.5%)
Estimated rent
$1,600/mo
Mortgage (P&I)
−$184
Tax + insurance
−$90
HOA
−$23
Vac / Maint / Mgmt
−$336
Net cashflow
$968/mo
Annual
$11,611/yr
Cap rate
39.47%
Cash-on-cash
118.48%
DSCR
6.27
1% rule
4.57%
Cash to close
$9,800
Investor read
- This is a 2-bed/2.0-bath single-family listed at $35k.
- At list price, monthly cash flow is $968 ($12k/yr) — positive.
- The deal already cash-flows at list — no discount required.
- Meets the 1% rule at list price ($2k rent vs $35k).
- Only 5 days on market — expect competitive offers; lowballing is unlikely to land.
- Local home prices are declining (-3.0%/yr); year-one equity from $242 of loan paydown is wiped out by about $1k of value loss. Plan a longer hold.
- Location reads 56/100 on livability (#1,337 in TX) — a working-class tenant base; expect higher turnover. Strengths: cost of living A+, housing A+, crime A-; Watch: amenities F, commute F, employment F.
- Quinlan ISD (rural): math 27% / reading 34% proficiency, ranked #610 of 826 in TX (top 74%) — families likely to look elsewhere, expect single-tenant / working-renter base with shorter leases.
- Zoned schools: D C Cannon El (765 students, 81% FRL); C B Thompson Middle (math 33% / reading 36%, grade F, #858 of 1,662 statewide, top 54%, 628 students, 77% FRL); Wh Ford H S (math 17% / reading 44%, grade F, #1,085 of 1,632 statewide, top 67%, 786 students, 68% FRL) — zoned schools average 75% FRL vs 60% district-wide (16 pts higher); higher-poverty schools than district average — tighter screening recommended.
- Watch-outs: property tax is 2.6% of price.
- Market conditions: 288 active listings in the ZIP; 4 comparable units currently listed for rent nearby; rentals leasing fast (median 1d on market — plan ~1-2 weeks tenant-placement turnaround); 1,289 units permitted in Hunt County in 2024 (527 in 5+ unit buildings).
- Hunt County population projected at +15% by 2050 — modest demand growth; plan on rents tracking national, not racing it.
- At projected returns (-3.0% appreciation + 3.0% rent growth), your $10k cash investment doubles in ~1 year — after that, you're playing with house money.
- Climate carrying-cost: major wind risk, 27% chance of damaging wind over 30y; extreme-heat days projected 7→24/yr by 2055 (HVAC capex compounding) — expect insurance premiums to compound above CPI over the hold.
- Cap rate 39.5% vs local median 4.6% in West Tawakoni — top-decile yield for the area; either an underpriced asset or a hidden risk that comps aren't pricing in. Stress-test before assuming the spread holds.
Questions for listing agent
- Built in 1970 — when were the roof, HVAC, electrical panel, plumbing, and water heater last replaced?
- Property tax is high relative to price — has the assessment been appealed recently, and will the sale trigger a re-assessment?
- What does the HOA fee cover, when was the last increase, and are there any pending special assessments or reserve-fund shortfalls?
- Is there a deadline driving the sale (1031 exchange, divorce, estate, relocation)? That informs how much negotiation room exists.
- Schools are F-rated, which usually means shorter tenancies and higher turnover. Who's the typical renter profile here, and what's been the actual vacancy rate?
- The area grade is low — what's the realistic commute time and amenity access for the typical tenant pool here? Any planned neighborhood developments (good or bad) we should know about?
- What's the average days-on-market for RENTAL listings here right now (not sales)? A rising rental-DOM trend means longer vacancies and softer asking-rent achievability than the comps imply.
- What's the recent tenant-quality profile in this submarket — average credit score on applications, eviction rate, late-payment / NSF rate, and stable-employment percentage? A property-management company in the area should have these aggregated.
CashFlowRE · CFR-X86H3RD7JJZ5T6
· Data 3 weeks ago
cashflowre.app · 2026-05-29