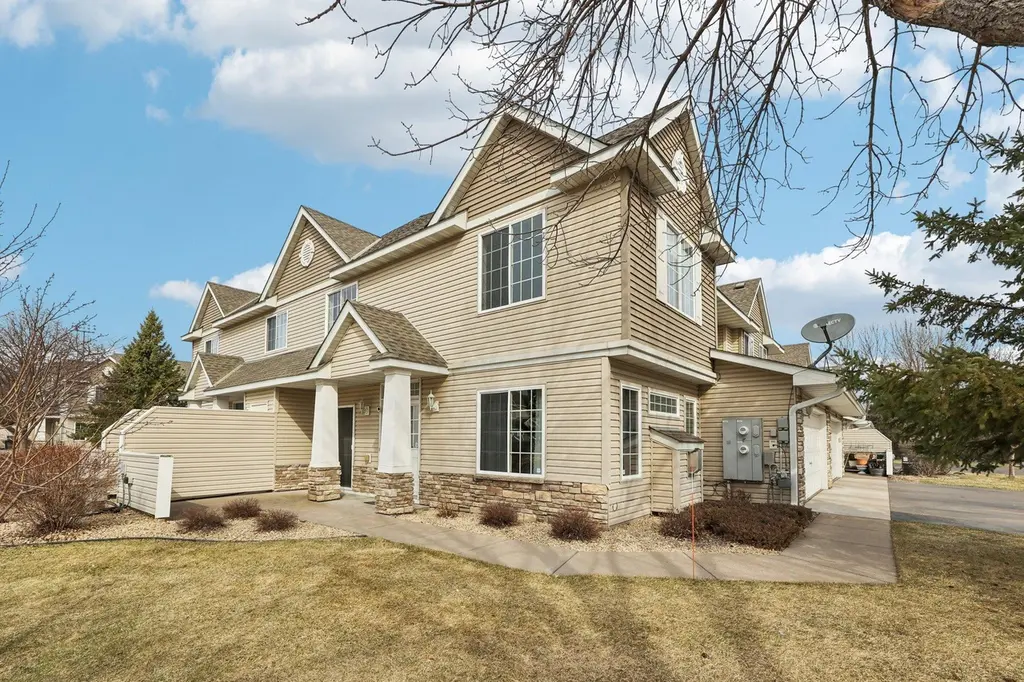
10794 Unity Ln N
Brooklyn Park, MN 55443
$265,000D
3 bd · 2.0 ba ·
1,613 sqft ·
Built 2004
· Townhouse
· Pending
· 60 DOM
Cashflow @ list (25.0% down · 7.5%)
Estimated rent
$2,189/mo
Mortgage (P&I)
−$1,390
Tax + insurance
−$405
HOA
−$415
Vac / Maint / Mgmt
−$460
Net cashflow
$-480/mo
Annual
$-5,765/yr
Cap rate
4.12%
Cash-on-cash
-7.77%
DSCR
0.65
1% rule
0.83%
Cash to close
$74,200
Investor read
- This is a 3-bed/2.0-bath townhouse listed at $265k.
- At list price, monthly cash flow is $-480 ($-6k/yr) — negative.
- To cash-flow at today's rent, offer at most $180k (32.0% below list).
- To meet the 1% rule (rent ≥ 1% of price), the offer needs to be $219k (17.4% below list).
- It's been on market 60 days — a 3% lower offer ($257k) is reasonable based on typical stale-listing flexibility.
- Recommended offer: $180k (32.0% below list) — sets the bar for cash-flow.
- Local home prices are declining (-3.0%/yr); year-one equity from $2k of loan paydown is wiped out by about $8k of value loss. Plan a longer hold.
- Location reads 81/100 on livability (#50 in MN, #1,308 nationally) — a professional / high-income tenant draw. Strengths: commute A+, employment A+, housing A+; Watch: crime C-, schools D, amenities F.
- Anoka-Hennepin Public School District (suburban): math 49% / reading 55% proficiency, ranked #71 of 301 in MN (top 24%) — acceptable for families but not a draw, mixed tenant base, ~2y average lease.
- Market conditions: Rents rising fast (+6.3%/yr); 169 active listings in the ZIP; 3 comparable units currently listed for rent nearby; rentals at typical pace (median 17d on market — plan ~3-4 weeks tenant-placement turnaround); solid renter incomes; 4,651 units permitted in Hennepin County in 2024 (2,443 in 5+ unit buildings).
- Hennepin County population projected at +30% by 2050 — long-run rental-demand tailwind backs the buy-and-hold thesis.
- 3 sale attempts with the ask held roughly flat each time — persistent listings suggest the price (not the market) is what's stuck; bring a comps-based counter.
- Current owner paid $196k; 35% above their basis — modest negotiation headroom, anchor on the comps not their cost.
- Cap rate 4.1% vs local median 3.3% in Brooklyn Park — meaningfully above typical; check what's discounted (condition, days-on-market, listing class) to confirm the premium yield is real.
Questions for listing agent
- What do current leases actually rent for vs. the listed asking? Can we see a recent rent roll and the last 12 months of T-12 income?
- It's been on market 60 days. Have you received any prior offers? Is the seller open to a 32% concession, seller financing, or rate buy-down credit?
- What does the HOA fee cover, when was the last increase, and are there any pending special assessments or reserve-fund shortfalls?
- Is there a deadline driving the sale (1031 exchange, divorce, estate, relocation)? That informs how much negotiation room exists.
- Schools are D-rated, which usually means shorter tenancies and higher turnover. Who's the typical renter profile here, and what's been the actual vacancy rate?
- The area grade is low — what's the realistic commute time and amenity access for the typical tenant pool here? Any planned neighborhood developments (good or bad) we should know about?
- What's the average days-on-market for RENTAL listings here right now (not sales)? A rising rental-DOM trend means longer vacancies and softer asking-rent achievability than the comps imply.
- What's the recent tenant-quality profile in this submarket — average credit score on applications, eviction rate, late-payment / NSF rate, and stable-employment percentage? A property-management company in the area should have these aggregated.
CashFlowRE · CFR-X9A610CSQ74D4Z
· Data 4 days ago
cashflowre.app · 2026-05-29