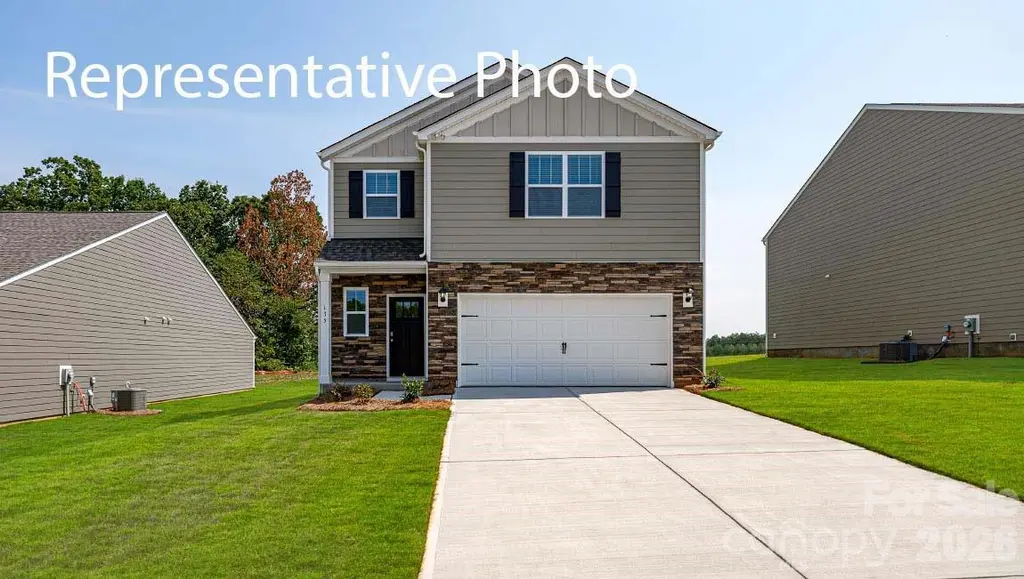
1018 Two Brothers Ln
York, SC 29745
$315,000D
3 bd · 2.5 ba ·
1,749 sqft ·
Built 2026
· Land
· Pending
· 1 DOM
Cashflow @ list (25.0% down · 7.5%)
Estimated rent
$2,641/mo
Mortgage (P&I)
−$1,652
Tax + insurance
−$305
HOA
−$102
Vac / Maint / Mgmt
−$555
Net cashflow
$28/mo
Annual
$330/yr
Cap rate
6.40%
Cash-on-cash
0.37%
DSCR
1.02
1% rule
0.84%
Cash to close
$88,200
Investor read
- This is a 3-bed/2.5-bath land listed at $315k.
- At list price, monthly cash flow is $28 ($330/yr) — positive.
- The deal already cash-flows at list — no discount required.
- To meet the 1% rule (rent ≥ 1% of price), the offer needs to be $264k (16.2% below list).
- Only 1 days on market — expect competitive offers; lowballing is unlikely to land.
- Recommended offer: $264k (16.2% below list) — sets the bar for 1% rule.
- Local home prices are declining (-3.0%/yr); year-one equity from $2k of loan paydown is wiped out by about $9k of value loss. Plan a longer hold.
- Location reads 65/100 on livability (#139 in SC) — a middle-class / working-renter tenant base. Strengths: cost of living A+, housing A+, health & safety A+; Watch: crime F, amenities F, commute F.
- York 01 (rural): math 31% / reading 40% proficiency, ranked #41 of 80 in SC (top 51%) — families likely to look elsewhere, expect single-tenant / working-renter base with shorter leases.
- Zoned schools: Hunter Street Elementary (math 52% / reading 47%, grade D, #168 of 597 statewide, top 31%, 405 students, 74% FRL); York Comprehensive High (math 39% / reading 82%, grade C+, #108 of 196 statewide, top 55%, 1,493 students, 68% FRL) — zoned schools average 71% FRL vs 54% district-wide (17 pts higher); higher-poverty schools than district average — tighter screening recommended.
- Zoned-school proficiency averages 55% at this address vs 36% district-wide (+20 pts) — the actual schools serving this property are materially stronger than the York 01 average implies; a family-tenant draw the district grade alone would hide.
- Market conditions: 541 active listings in the ZIP; 2 comparable units currently listed for rent nearby; solid renter incomes; 2,550 units permitted in York County in 2024 (350 in 5+ unit buildings).
- York County population projected at +44% by 2050 — long-run rental-demand tailwind backs the buy-and-hold thesis.
- Cap rate 6.4% vs local median 4.6% in York — top-decile yield for the area; either an underpriced asset or a hidden risk that comps aren't pricing in. Stress-test before assuming the spread holds.
- This rent runs 40% of the median local income ($79k/yr) — at the standard rent-burdened threshold; future hikes will face affordability resistance.
Questions for listing agent
- What does the HOA fee cover, when was the last increase, and are there any pending special assessments or reserve-fund shortfalls?
- Is there a deadline driving the sale (1031 exchange, divorce, estate, relocation)? That informs how much negotiation room exists.
- Schools are D-rated, which usually means shorter tenancies and higher turnover. Who's the typical renter profile here, and what's been the actual vacancy rate?
- Crime grade is F in this area — have there been break-ins, vandalism, or insurance claims at this property in the last 3 years? What carrier currently insures it and at what premium?
- The area grade is low — what's the realistic commute time and amenity access for the typical tenant pool here? Any planned neighborhood developments (good or bad) we should know about?
- What's the average days-on-market for RENTAL listings here right now (not sales)? A rising rental-DOM trend means longer vacancies and softer asking-rent achievability than the comps imply.
- What's the recent tenant-quality profile in this submarket — average credit score on applications, eviction rate, late-payment / NSF rate, and stable-employment percentage? A property-management company in the area should have these aggregated.
- How much new for-sale + rental construction is in the pipeline within 1–3 miles? Heavy new supply typically softens prices + rents 12–24 months out; constrained supply supports both.
CashFlowRE · CFR-XAB37WCEJDAXVG
· Data 1 week ago
cashflowre.app · 2026-05-29