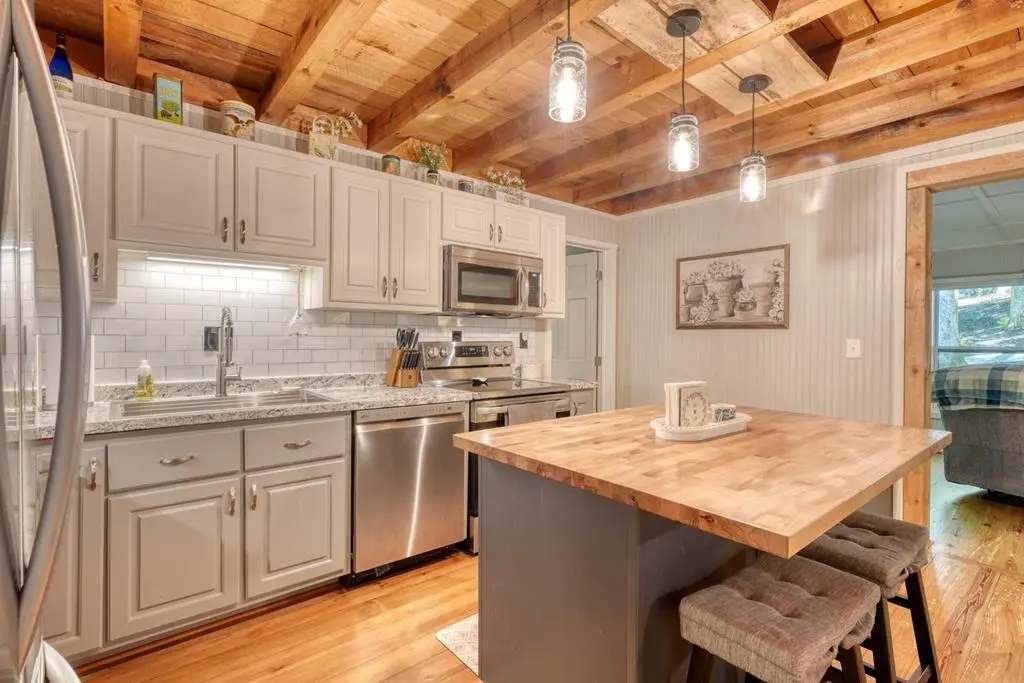
919 New Hope Rd
Morganton, GA 30560
$399,900D
4 bd · 2.5 ba ·
1,664 sqft ·
Built 2000
· SingleFamily
· Pending
· 24 DOM
Cashflow @ list (25.0% down · 7.5%)
Estimated rent
$3,152/mo
Mortgage (P&I)
−$2,097
Tax + insurance
−$666
HOA
−$0
Vac / Maint / Mgmt
−$662
Net cashflow
$-273/mo
Annual
$-3,282/yr
Cap rate
5.47%
Cash-on-cash
-2.93%
DSCR
0.87
1% rule
0.79%
Cash to close
$111,972
Investor read
- This is a 4-bed/2.5-bath single-family listed at $400k.
- At list price, monthly cash flow is $-273 ($-3k/yr) — negative.
- To cash-flow at today's rent, offer at most $360k (9.9% below list).
- To meet the 1% rule (rent ≥ 1% of price), the offer needs to be $315k (21.2% below list).
- It's been on market 24 days — a 2% lower offer ($394k) is reasonable based on typical stale-listing flexibility.
- Recommended offer: $315k (21.2% below list) — sets the bar for 1% rule.
- Local home prices are declining (-3.0%/yr); year-one equity from $3k of loan paydown is wiped out by about $12k of value loss. Plan a longer hold.
- Location reads 57/100 on livability (#456 in GA) — a working-class tenant base; expect higher turnover. Strengths: cost of living A+; Watch: health & safety C-, crime D-, amenities F.
- Fannin County (rural): math 40% / reading 39% proficiency, ranked #51 of 174 in GA (top 29%) — families likely to look elsewhere, expect single-tenant / working-renter base with shorter leases.
- Zoned schools: East Fannin Elementary School (math 42% / reading 32%, grade F, #485 of 1,228 statewide, top 41%, 415 students, 63% FRL); Fannin County Middle School (math 41% / reading 43%, grade D-, #126 of 470 statewide, top 28%, 619 students, 53% FRL); Fannin County High School (math 27% / reading 47%, grade F, #68 of 424 statewide, top 17%, 900 students, 44% FRL) — zoned schools at 53% FRL track the district average.
- Market conditions: 310 active listings in the ZIP; 375 units permitted in Fannin County in 2024 (0 in 5+ unit buildings).
- 4 sale attempts since 20y ago with the ask held roughly flat each time — persistent listings suggest the price (not the market) is what's stuck; bring a comps-based counter.
- Current owner paid $114k; list at $400k implies a 252% gain — meaningful room to come down on a strong offer.
- Climate carrying-cost: major wildfire risk — expect insurance premiums to compound above CPI over the hold.
- Cap rate 5.5% vs local median 3.1% in Morganton — top-decile yield for the area; either an underpriced asset or a hidden risk that comps aren't pricing in. Stress-test before assuming the spread holds.
Questions for listing agent
- What do current leases actually rent for vs. the listed asking? Can we see a recent rent roll and the last 12 months of T-12 income?
- Is there a deadline driving the sale (1031 exchange, divorce, estate, relocation)? That informs how much negotiation room exists.
- Schools are F-rated, which usually means shorter tenancies and higher turnover. Who's the typical renter profile here, and what's been the actual vacancy rate?
- Crime grade is D in this area — have there been break-ins, vandalism, or insurance claims at this property in the last 3 years? What carrier currently insures it and at what premium?
- The area grade is low — what's the realistic commute time and amenity access for the typical tenant pool here? Any planned neighborhood developments (good or bad) we should know about?
- What's the average days-on-market for RENTAL listings here right now (not sales)? A rising rental-DOM trend means longer vacancies and softer asking-rent achievability than the comps imply.
- What's the recent tenant-quality profile in this submarket — average credit score on applications, eviction rate, late-payment / NSF rate, and stable-employment percentage? A property-management company in the area should have these aggregated.
- How much new for-sale + rental construction is in the pipeline within 1–3 miles? Heavy new supply typically softens prices + rents 12–24 months out; constrained supply supports both.
CashFlowRE · CFR-XDQRPGD2DPHX8Y
· Data 3 weeks ago
cashflowre.app · 2026-05-29