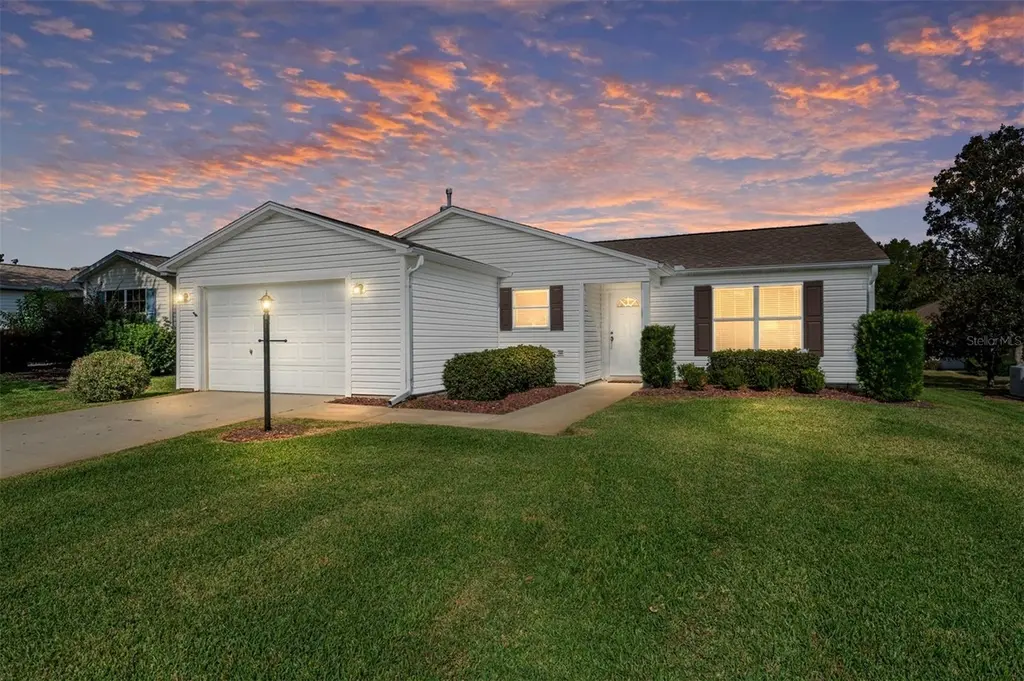
8065 SE 175th Columbia Pl
The Villages, FL 32162
$269,900B-
2 bd · 2.0 ba ·
1,120 sqft ·
Built 2002
· SingleFamily
· Active
· 202 DOM
Cashflow @ list (25.0% down · 7.5%)
Estimated rent
$3,487/mo
Mortgage (P&I)
−$1,415
Tax + insurance
−$380
HOA
−$204
Vac / Maint / Mgmt
−$732
Net cashflow
$755/mo
Annual
$9,065/yr
Cap rate
9.65%
Cash-on-cash
12.00%
DSCR
1.53
1% rule
1.29%
Cash to close
$75,572
Investor read
- This is a 2-bed/2.0-bath single-family listed at $270k.
- At list price, monthly cash flow is $755 ($9k/yr) — positive.
- The deal already cash-flows at list — no discount required.
- Meets the 1% rule at list price ($3k rent vs $270k).
- It's been on market 202 days — a 12% lower offer ($238k) is reasonable based on typical stale-listing flexibility.
- Recommended offer: $238k (12.0% below list) — sets the bar for market timing.
- Local home prices are declining (-3.0%/yr); year-one equity from $2k of loan paydown is wiped out by about $8k of value loss. Plan a longer hold.
- Location reads 70/100 on livability (#431 in FL) — a middle-class / working-renter tenant base. Strengths: schools A+, crime A+, housing A; Watch: amenities F, commute F, health & safety F.
- Marion (rural): math 42% / reading 43% proficiency, ranked #61 of 73 in FL (top 84%) — families likely to look elsewhere, expect single-tenant / working-renter base with shorter leases; 61% free/reduced lunch — lower-income household profile, screen leases tightly.
- Market conditions: Rents rising (+3.9%/yr); 550 active listings in the ZIP; 10 comparable units currently listed for rent nearby; rentals at typical pace (median 21d on market — plan ~3-4 weeks tenant-placement turnaround); 7,071 units permitted in Marion County in 2024 (534 in 5+ unit buildings).
- Marion County population projected at +13% by 2050 — modest demand growth; plan on rents tracking national, not racing it.
- At projected returns (-3.0% appreciation + 3.9% rent growth), your $76k cash investment doubles in ~9 years — after that, you're playing with house money.
- Climate carrying-cost: severe wind risk, 99% chance of damaging wind over 30y; extreme-heat days projected 7→21/yr by 2055 (HVAC capex compounding) — expect insurance premiums to compound above CPI over the hold.
- Cap rate 9.7% vs local median 5.0% in The Villages — top-decile yield for the area; either an underpriced asset or a hidden risk that comps aren't pricing in. Stress-test before assuming the spread holds.
- At $3,487/mo this rent would consume 56% of the median local household income ($74k/yr) (locally 987% of renters already pay >50% of income on rent) — very limited rent-growth headroom before tenants either downsize or default.
Questions for listing agent
- It's been on market 202 days. Have you received any prior offers? Is the seller open to a 12% concession, seller financing, or rate buy-down credit?
- What does the HOA fee cover, when was the last increase, and are there any pending special assessments or reserve-fund shortfalls?
- Why hasn't it sold? Are there any deal-killer items the seller is aware of (foundation, flood, title, zoning, code violations)?
- Is there a deadline driving the sale (1031 exchange, divorce, estate, relocation)? That informs how much negotiation room exists.
- Schools are A-rated — typically a magnet for longer-tenancy family renters. What's the average tenant stay here, and is there a school-zone premium baked into asking?
- What's the average days-on-market for RENTAL listings here right now (not sales)? A rising rental-DOM trend means longer vacancies and softer asking-rent achievability than the comps imply.
- What's the recent tenant-quality profile in this submarket — average credit score on applications, eviction rate, late-payment / NSF rate, and stable-employment percentage? A property-management company in the area should have these aggregated.
- How much new for-sale + rental construction is in the pipeline within 1–3 miles? Heavy new supply typically softens prices + rents 12–24 months out; constrained supply supports both.
CashFlowRE · CFR-XEXA9A41PHD4NF
· Data 2 days ago
cashflowre.app · 2026-05-29