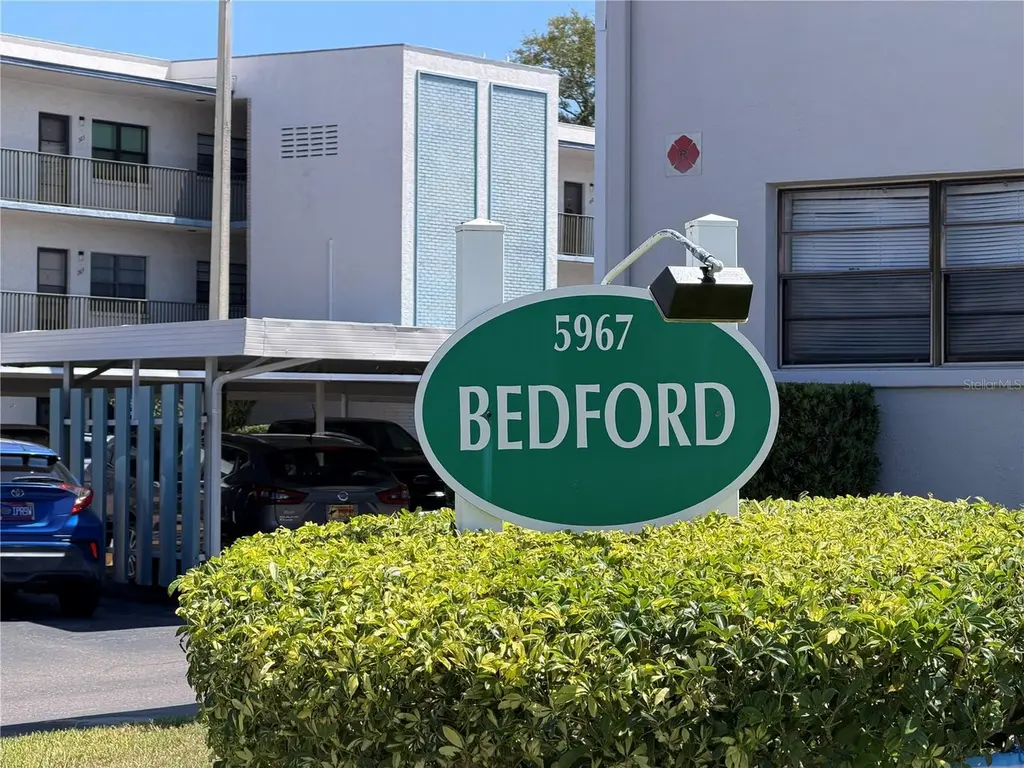
5967 Terrace Park Dr N #104
West Lealman, FL 33709
$114,500D
2 bd · 2.0 ba ·
830 sqft ·
Built 1977
· Condo
· Active
· 60 DOM
Cashflow @ list (25.0% down · 7.5%)
Estimated rent
$1,777/mo
Mortgage (P&I)
−$600
Tax + insurance
−$171
HOA
−$772
Vac / Maint / Mgmt
−$373
Net cashflow
$-139/mo
Annual
$-1,671/yr
Cap rate
5.53%
Cash-on-cash
-2.72%
DSCR
0.88
1% rule
1.55%
Cash to close
$32,060
Investor read
- This is a 2-bed/2.0-bath condo listed at $114k.
- At list price, monthly cash flow is $-139 ($-2k/yr) — negative.
- To cash-flow at today's rent, offer at most $90k (21.5% below list).
- Meets the 1% rule at list price ($2k rent vs $114k).
- It's been on market 60 days — a 3% lower offer ($111k) is reasonable based on typical stale-listing flexibility.
- Recommended offer: $90k (21.5% below list) — sets the bar for cash-flow.
- Local home prices are declining (-3.0%/yr); year-one equity from $792 of loan paydown is wiped out by about $3k of value loss. Plan a longer hold.
- Location reads 81/100 on livability (#84 in FL, #1,396 nationally) — a professional / high-income tenant draw. Strengths: commute A+, cost of living A+, housing A+; Watch: schools C-, employment D+, amenities F.
- Pinellas (suburban): math 51% / reading 51% proficiency, ranked #31 of 73 in FL (top 42%) — acceptable for families but not a draw, mixed tenant base, ~2y average lease.
- Watch-outs: flood insurance adds $66/mo; HOA is 43% of rent.
- Market conditions: Rents flat; 309 active listings in the ZIP; 31 comparable units currently listed for rent nearby; rentals at typical pace (median 25d on market — plan ~3-4 weeks tenant-placement turnaround); 2,676 units permitted in Pinellas County in 2024 (1,422 in 5+ unit buildings).
- Pinellas County population projected at +14% by 2050 — modest demand growth; plan on rents tracking national, not racing it.
- 3 sale attempts since 8y ago with the ask held roughly flat each time — persistent listings suggest the price (not the market) is what's stuck; bring a comps-based counter.
- Climate carrying-cost: severe flood risk; severe wind risk, 99% chance of damaging wind over 30y; extreme-heat days projected 7→25/yr by 2055 (HVAC capex compounding) — expect insurance premiums to compound above CPI over the hold.
- Cap rate 5.5% vs local median 1.8% in West Lealman — top-decile yield for the area; either an underpriced asset or a hidden risk that comps aren't pricing in. Stress-test before assuming the spread holds.
- This rent runs 40% of the median local income ($54k/yr) — at the standard rent-burdened threshold; future hikes will face affordability resistance.
Questions for listing agent
- What do current leases actually rent for vs. the listed asking? Can we see a recent rent roll and the last 12 months of T-12 income?
- It's been on market 60 days. Have you received any prior offers? Is the seller open to a 21% concession, seller financing, or rate buy-down credit?
- Built in 1977 — when were the roof, HVAC, electrical panel, plumbing, and water heater last replaced?
- What's the actual annual flood-insurance premium (NFIP or private), and is the property in a SFHA with mandatory coverage?
- What does the HOA fee cover, when was the last increase, and are there any pending special assessments or reserve-fund shortfalls?
- Any open or pending special assessments — roof, HVAC, plumbing, elevator, façade? What's the per-unit balance and payoff schedule, and is the seller paying it off at close or rolling it to the buyer?
- Is there a deadline driving the sale (1031 exchange, divorce, estate, relocation)? That informs how much negotiation room exists.
- The area grade is low — what's the realistic commute time and amenity access for the typical tenant pool here? Any planned neighborhood developments (good or bad) we should know about?
CashFlowRE · CFR-XF3XTK39S60ATK
· Data 2 days ago
cashflowre.app · 2026-05-29