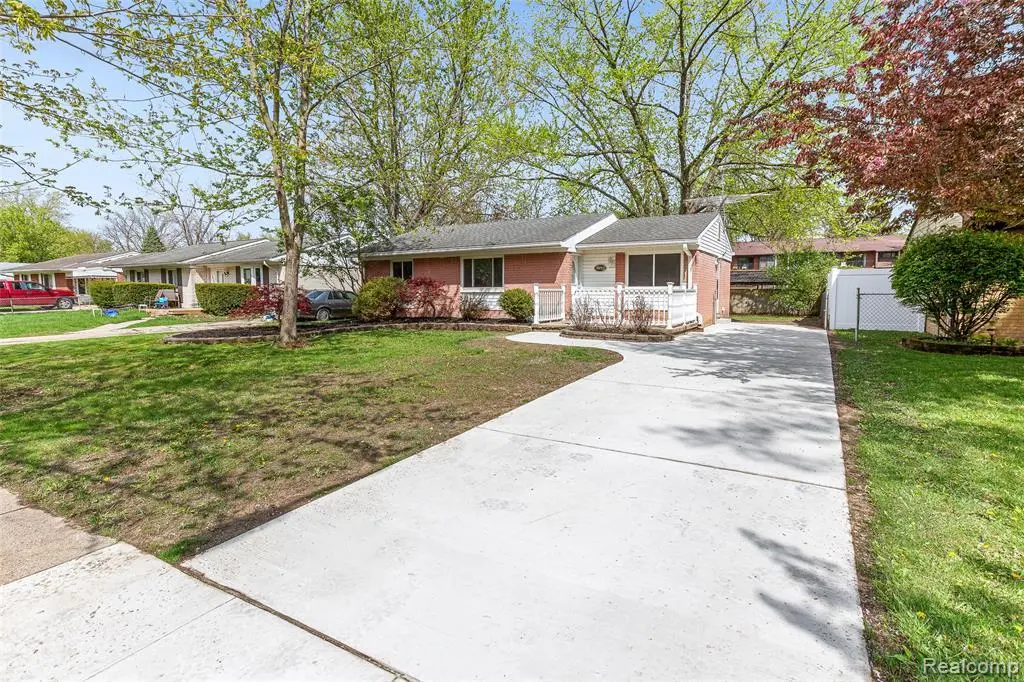
10753 Van Buren St
Belleville, MI 48111
$225,000F
3 bd · 1.0 ba ·
959 sqft ·
Built 1969
· SingleFamily
· Pending
· 3 DOM
Cashflow @ list (25.0% down · 7.5%)
Estimated rent
$1,636/mo
Mortgage (P&I)
−$1,180
Tax + insurance
−$157
HOA
−$0
Vac / Maint / Mgmt
−$344
Net cashflow
$-44/mo
Annual
$-528/yr
Cap rate
6.06%
Cash-on-cash
-0.84%
DSCR
0.96
1% rule
0.73%
Cash to close
$63,000
Investor read
- This is a 3-bed/1.0-bath single-family listed at $225k.
- At list price, monthly cash flow is $-44 ($-528/yr) — negative.
- To cash-flow at today's rent, offer at most $217k (3.5% below list).
- To meet the 1% rule (rent ≥ 1% of price), the offer needs to be $164k (27.3% below list).
- Only 3 days on market — expect competitive offers; lowballing is unlikely to land.
- Recommended offer: $164k (27.3% below list) — sets the bar for 1% rule.
- Local home prices are declining (-3.0%/yr); year-one equity from $2k of loan paydown is wiped out by about $7k of value loss. Plan a longer hold.
- Location reads 75/100 on livability (#164 in MI, #4,360 nationally) — a middle-class / working-renter tenant base. Strengths: cost of living A+, housing A+, health & safety A+; Watch: employment D, amenities F, commute F.
- Van Buren Public Schools (suburban): math 33% / reading 43% proficiency, ranked #228 of 540 in MI (top 42%) — families likely to look elsewhere, expect single-tenant / working-renter base with shorter leases.
- Zoned schools: Tyler Road Elementary School (math 44% / reading 44%, grade F, #484 of 1,397 statewide, top 38%, 363 students, 67% FRL); Mcbride Middle School (math 28% / reading 47%, grade F, #243 of 493 statewide, top 50%, 581 students, 64% FRL); Belleville High School (math 32% / reading 52%, grade F, #264 of 713 statewide, top 41%, 1,770 students, 52% FRL).
- Market conditions: Rents rising (+3.6%/yr); 222 active listings in the ZIP; 2 comparable units currently listed for rent nearby; solid renter incomes; 2,639 units permitted in Wayne County in 2024 (1,216 in 5+ unit buildings).
- Wayne County population projected at -17% by 2050 — secular population decline; favor cash flow + early exit over multi-decade hold.
- 7 sale attempts since 19y ago with the ask held roughly flat each time — persistent listings suggest the price (not the market) is what's stuck; bring a comps-based counter.
- Current owner paid $68k; list at $225k implies a 233% gain — meaningful room to come down on a strong offer.
- Cap rate 6.1% vs local median 3.0% in Belleville — top-decile yield for the area; either an underpriced asset or a hidden risk that comps aren't pricing in. Stress-test before assuming the spread holds.
Questions for listing agent
- What do current leases actually rent for vs. the listed asking? Can we see a recent rent roll and the last 12 months of T-12 income?
- Built in 1969 — when were the roof, HVAC, electrical panel, plumbing, and water heater last replaced?
- Is there a deadline driving the sale (1031 exchange, divorce, estate, relocation)? That informs how much negotiation room exists.
- Schools are D-rated, which usually means shorter tenancies and higher turnover. Who's the typical renter profile here, and what's been the actual vacancy rate?
- The area grade is low — what's the realistic commute time and amenity access for the typical tenant pool here? Any planned neighborhood developments (good or bad) we should know about?
- What's the average days-on-market for RENTAL listings here right now (not sales)? A rising rental-DOM trend means longer vacancies and softer asking-rent achievability than the comps imply.
- What's the recent tenant-quality profile in this submarket — average credit score on applications, eviction rate, late-payment / NSF rate, and stable-employment percentage? A property-management company in the area should have these aggregated.
- How much new for-sale + rental construction is in the pipeline within 1–3 miles? Heavy new supply typically softens prices + rents 12–24 months out; constrained supply supports both.
CashFlowRE · CFR-XHTTKHD2GE8KY9
· Data 3 weeks ago
cashflowre.app · 2026-05-29