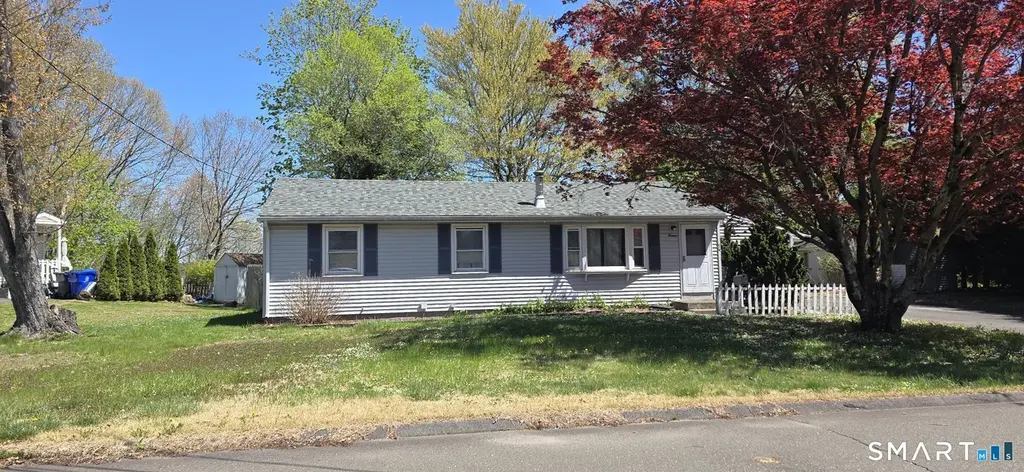
14 Sky St
Southwood Acres, CT 06082
$219,900C
3 bd · 1.0 ba ·
1,008 sqft ·
Built 1958
· SingleFamily
· Under Contract
· 3 DOM
Cashflow @ list (25.0% down · 7.5%)
Estimated rent
$2,364/mo
Mortgage (P&I)
−$1,153
Tax + insurance
−$514
HOA
−$0
Vac / Maint / Mgmt
−$496
Net cashflow
$200/mo
Annual
$2,397/yr
Cap rate
7.38%
Cash-on-cash
3.89%
DSCR
1.17
1% rule
1.07%
Cash to close
$61,572
Investor read
- This is a 3-bed/1.0-bath single-family listed at $220k.
- At list price, monthly cash flow is $200 ($2k/yr) — positive.
- The deal already cash-flows at list — no discount required.
- Meets the 1% rule at list price ($2k rent vs $220k).
- Only 3 days on market — expect competitive offers; lowballing is unlikely to land.
- Local home prices are declining (-3.0%/yr); year-one equity from $2k of loan paydown is wiped out by about $7k of value loss. Plan a longer hold.
- Location reads 72/100 on livability (#83 in CT) — a middle-class / working-renter tenant base. Strengths: employment A+, housing A+, crime A; Watch: cost of living C-, amenities F, commute F.
- Enfield School District (suburban): math 25% / reading 41% proficiency, ranked #114 of 153 in CT (top 74%) — families likely to look elsewhere, expect single-tenant / working-renter base with shorter leases.
- Zoned schools: Hazardville Memorial School (329 students, 44% FRL); John F. Kennedy Middle School (math 22% / reading 39%, grade F, #138 of 175 statewide, top 79%, 1,096 students, 46% FRL); Enfield High School (math 29% / reading 54%, grade F, #102 of 194 statewide, top 53%, 1,490 students, 40% FRL).
- Watch-outs: built in 1958 — expect roof / HVAC / electrical / plumbing capex.
- Market conditions: Rents rising (+3.9%/yr); 188 active listings in the ZIP; 1 comparable units currently listed for rent nearby; solid renter incomes; 1,867 units permitted in Capitol Planning Region in 2024 (1,399 in 5+ unit buildings).
- 5 sale attempts since 19y ago with the ask held roughly flat each time — persistent listings suggest the price (not the market) is what's stuck; bring a comps-based counter.
- Current owner paid $132k; list at $220k implies a 67% gain — meaningful room to come down on a strong offer.
- Climate carrying-cost: major wind risk, 27% chance of damaging wind over 30y — expect insurance premiums to compound above CPI over the hold.
- Cap rate 7.4% vs local median 4.2% in Southwood Acres — top-decile yield for the area; either an underpriced asset or a hidden risk that comps aren't pricing in. Stress-test before assuming the spread holds.
- This rent runs 31% of the median local income ($90k/yr) — at the standard rent-burdened threshold; future hikes will face affordability resistance.
Questions for listing agent
- Built in 1958 — when were the roof, HVAC, electrical panel, plumbing, and water heater last replaced?
- Is there a deadline driving the sale (1031 exchange, divorce, estate, relocation)? That informs how much negotiation room exists.
- What's the average days-on-market for RENTAL listings here right now (not sales)? A rising rental-DOM trend means longer vacancies and softer asking-rent achievability than the comps imply.
- What's the recent tenant-quality profile in this submarket — average credit score on applications, eviction rate, late-payment / NSF rate, and stable-employment percentage? A property-management company in the area should have these aggregated.
- How much new for-sale + rental construction is in the pipeline within 1–3 miles? Heavy new supply typically softens prices + rents 12–24 months out; constrained supply supports both.
CashFlowRE · CFR-XJ0JHG5BHMVJJM
· Data 3 weeks ago
cashflowre.app · 2026-05-29