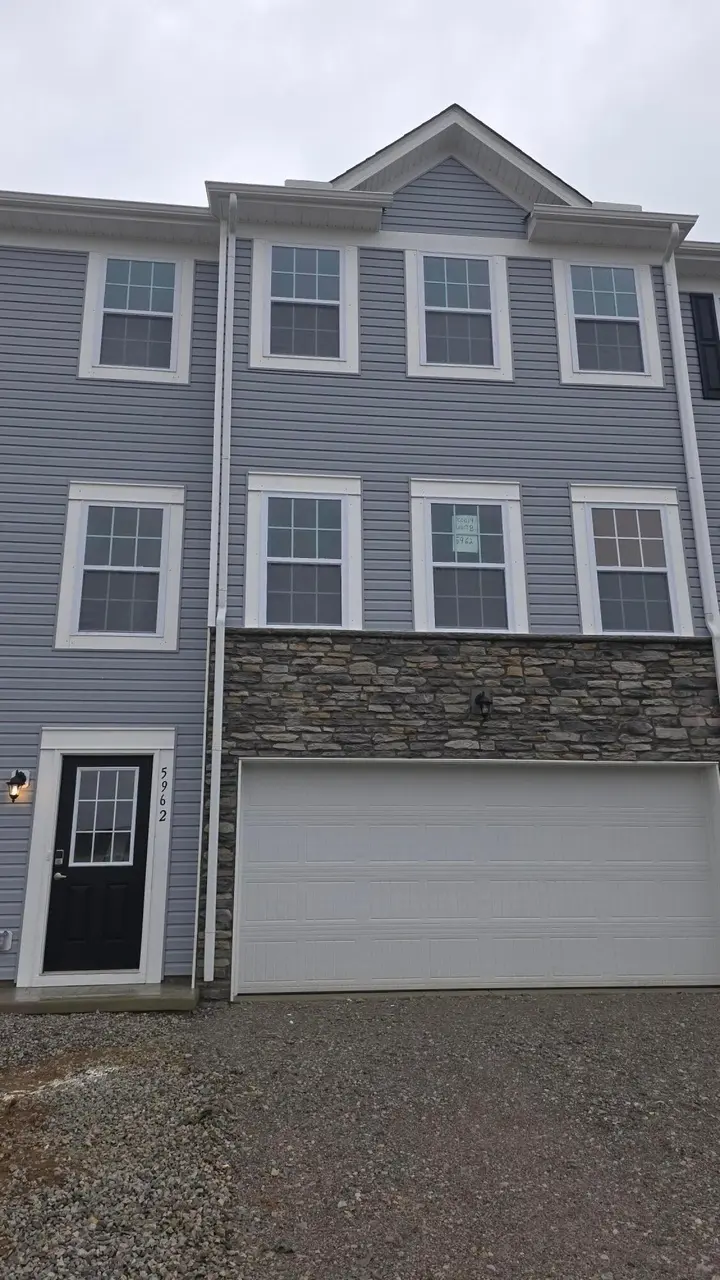
5962 Abernathy Ln
Columbus, OH 43232
$285,505D-
3 bd · 2.5 ba ·
1,845 sqft ·
Built 2026
· SingleFamily
· Active
· 107 DOM
Cashflow @ list (25.0% down · 7.5%)
Estimated rent
$2,008/mo
Mortgage (P&I)
−$1,497
Tax + insurance
−$476
HOA
−$13
Vac / Maint / Mgmt
−$422
Net cashflow
$-400/mo
Annual
$-4,800/yr
Cap rate
4.61%
Cash-on-cash
-6.00%
DSCR
0.73
1% rule
0.70%
Cash to close
$79,941
Investor read
- This is a 3-bed/2.5-bath single-family listed at $286k.
- At list price, monthly cash flow is $-400 ($-5k/yr) — negative.
- To cash-flow at today's rent, offer at most $228k (20.3% below list).
- To meet the 1% rule (rent ≥ 1% of price), the offer needs to be $201k (29.7% below list).
- It's been on market 107 days — a 9% lower offer ($260k) is reasonable based on typical stale-listing flexibility.
- Recommended offer: $201k (29.7% below list) — sets the bar for 1% rule.
- Local home prices are declining (-3.0%/yr); year-one equity from $2k of loan paydown is wiped out by about $9k of value loss. Plan a longer hold.
- Location reads 81/100 on livability (#97 in OH, #1,491 nationally) — a professional / high-income tenant draw. Strengths: commute A+, cost of living A+, housing A+; Watch: employment C-, crime F.
- Groveport Madison Local (suburban): math 23% / reading 38% proficiency, ranked #573 of 656 in OH (top 87%) — families likely to look elsewhere, expect single-tenant / working-renter base with shorter leases; 65% free/reduced lunch — lower-income household profile, screen leases tightly.
- Market conditions: Rents rising (+2.4%/yr); 89 active listings in the ZIP; 24 comparable units currently listed for rent nearby; rentals at typical pace (median 17d on market — plan ~3-4 weeks tenant-placement turnaround); 8,139 units permitted in Franklin County in 2024 (5,940 in 5+ unit buildings).
- Franklin County population projected at +34% by 2050 — long-run rental-demand tailwind backs the buy-and-hold thesis.
- 3 sale attempts with the ask held roughly flat each time — persistent listings suggest the price (not the market) is what's stuck; bring a comps-based counter.
- Cap rate 4.6% vs local median 3.8% in Columbus — meaningfully above typical; check what's discounted (condition, days-on-market, listing class) to confirm the premium yield is real.
- At $2,008/mo this rent would consume 47% of the median local household income ($51k/yr) (locally 2584% of renters already pay >50% of income on rent) — very limited rent-growth headroom before tenants either downsize or default.
Questions for listing agent
- What do current leases actually rent for vs. the listed asking? Can we see a recent rent roll and the last 12 months of T-12 income?
- It's been on market 107 days. Have you received any prior offers? Is the seller open to a 30% concession, seller financing, or rate buy-down credit?
- What does the HOA fee cover, when was the last increase, and are there any pending special assessments or reserve-fund shortfalls?
- Why hasn't it sold? Are there any deal-killer items the seller is aware of (foundation, flood, title, zoning, code violations)?
- Is there a deadline driving the sale (1031 exchange, divorce, estate, relocation)? That informs how much negotiation room exists.
- Crime grade is F in this area — have there been break-ins, vandalism, or insurance claims at this property in the last 3 years? What carrier currently insures it and at what premium?
- The area grade is low — what's the realistic commute time and amenity access for the typical tenant pool here? Any planned neighborhood developments (good or bad) we should know about?
- What's the average days-on-market for RENTAL listings here right now (not sales)? A rising rental-DOM trend means longer vacancies and softer asking-rent achievability than the comps imply.
CashFlowRE · CFR-XKPYMB4MQE6C72
· Data 2 days ago
cashflowre.app · 2026-05-29