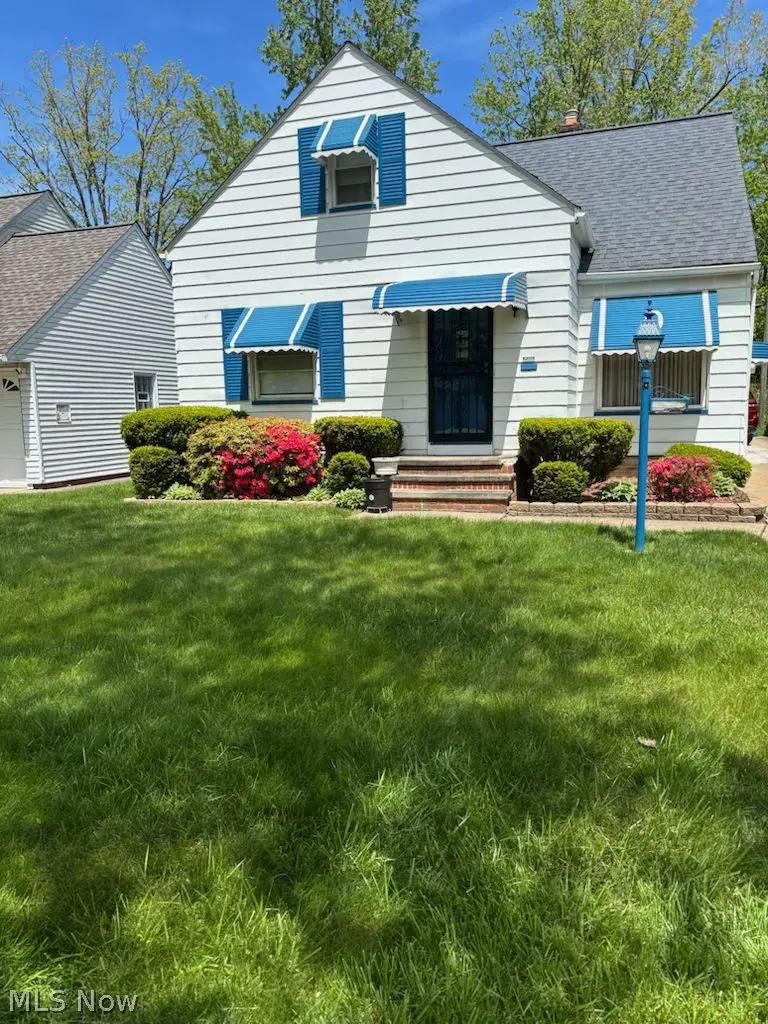
19205 Sunset Dr
Warrensville Heights, OH 44122
$155,000C-
3 bd · 1.0 ba ·
1,284 sqft ·
Built 1951
· SingleFamily
· Active
· 32 DOM
Cashflow @ list (25.0% down · 7.5%)
Estimated rent
$1,821/mo
Mortgage (P&I)
−$813
Tax + insurance
−$207
HOA
−$0
Vac / Maint / Mgmt
−$382
Net cashflow
$419/mo
Annual
$5,029/yr
Cap rate
9.54%
Cash-on-cash
11.59%
DSCR
1.52
1% rule
1.18%
Cash to close
$43,400
Investor read
- This is a 3-bed/1.0-bath single-family listed at $155k.
- At list price, monthly cash flow is $419 ($5k/yr) — positive.
- The deal already cash-flows at list — no discount required.
- Meets the 1% rule at list price ($2k rent vs $155k).
- It's been on market 32 days — a 3% lower offer ($150k) is reasonable based on typical stale-listing flexibility.
- Recommended offer: $150k (3.0% below list) — sets the bar for market timing.
- Local home prices are declining (-3.0%/yr); year-one equity from $1k of loan paydown is wiped out by about $5k of value loss. Plan a longer hold.
- Location reads 73/100 on livability (#316 in OH) — a middle-class / working-renter tenant base. Strengths: cost of living A+, housing A+; Watch: crime C-, health & safety D, commute D-.
- Warrensville Heights City (suburban): math 22% / reading 29% proficiency, ranked #604 of 656 in OH (top 92%) — low school quality limits family demand, transient renter base, plan for 1-2y turnover; 84% free/reduced lunch — lower-income household profile, screen leases tightly.
- Zoned schools: Warrensville Heights Elementary School (876 students, 0% FRL); Warrensville Heights Middle School (math 13% / reading 23%, grade F, #617 of 654 statewide, top 94%, 374 students, 0% FRL); Warrensville Heights High School (math 12% / reading 47%, grade F, #619 of 781 statewide, top 80%, 547 students, 0% FRL) — zoned schools average 0% FRL vs 84% district-wide (84 pts lower); this property's tenant base skews higher-income than the district average.
- Watch-outs: built in 1951 — expect roof / HVAC / electrical / plumbing capex.
- Market conditions: Rents rising (+1.1%/yr); 183 active listings in the ZIP; 40 comparable units currently listed for rent nearby; rentals at typical pace (median 23d on market — plan ~3-4 weeks tenant-placement turnaround); solid renter incomes; 1,441 units permitted in Cuyahoga County in 2024 (700 in 5+ unit buildings).
- Cuyahoga County population projected to shrink 8% by 2050 — rents likely to lag national; underwrite the cash flow, not the appreciation.
Questions for listing agent
- It's been on market 32 days. Have you received any prior offers? Is the seller open to a 3% concession, seller financing, or rate buy-down credit?
- Built in 1951 — when were the roof, HVAC, electrical panel, plumbing, and water heater last replaced?
- Is there a deadline driving the sale (1031 exchange, divorce, estate, relocation)? That informs how much negotiation room exists.
- What's the average days-on-market for RENTAL listings here right now (not sales)? A rising rental-DOM trend means longer vacancies and softer asking-rent achievability than the comps imply.
- What's the recent tenant-quality profile in this submarket — average credit score on applications, eviction rate, late-payment / NSF rate, and stable-employment percentage? A property-management company in the area should have these aggregated.
- How much new for-sale + rental construction is in the pipeline within 1–3 miles? Heavy new supply typically softens prices + rents 12–24 months out; constrained supply supports both.
CashFlowRE · CFR-XMVHFF0SM1NGBY
· Data 22 h ago
cashflowre.app · 2026-05-29