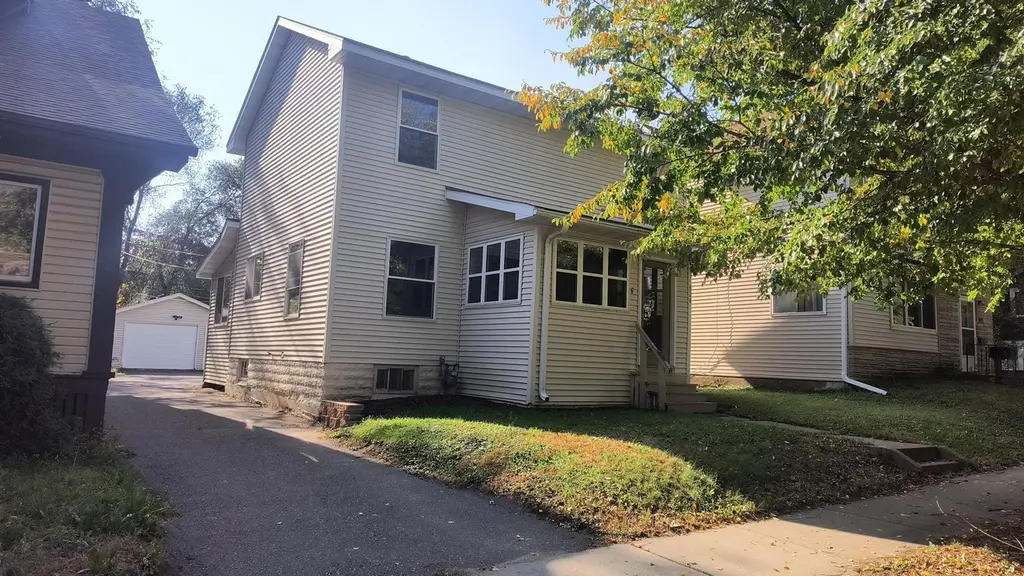
926 Wilson Ave
St. Paul, MN 55106
$229,900C
3 bd · 2.0 ba ·
1,320 sqft ·
Built 1915
· SingleFamily
· Pending
· 15 DOM
Cashflow @ list (25.0% down · 7.5%)
Estimated rent
$2,682/mo
Mortgage (P&I)
−$1,206
Tax + insurance
−$460
HOA
−$0
Vac / Maint / Mgmt
−$563
Net cashflow
$454/mo
Annual
$5,442/yr
Cap rate
8.66%
Cash-on-cash
8.45%
DSCR
1.38
1% rule
1.17%
Cash to close
$64,372
Investor read
- This is a 3-bed/2.0-bath single-family listed at $230k.
- At list price, monthly cash flow is $454 ($5k/yr) — positive.
- The deal already cash-flows at list — no discount required.
- Meets the 1% rule at list price ($3k rent vs $230k).
- It's been on market 15 days — a 2% lower offer ($226k) is reasonable based on typical stale-listing flexibility.
- Recommended offer: $226k (1.5% below list) — sets the bar for market timing.
- Local home prices are declining (-3.0%/yr); year-one equity from $2k of loan paydown is wiped out by about $7k of value loss. Plan a longer hold.
- Location reads: area grade C — affects rentability + tenant quality, not the cash-flow math above.
- St. Paul Public School District (urban): math 21% / reading 33% proficiency, ranked #270 of 301 in MN (top 90%) — low school quality limits family demand, transient renter base, plan for 1-2y turnover; 64% free/reduced lunch — lower-income household profile, screen leases tightly.
- Watch-outs: built in 1915 — expect roof / HVAC / electrical / plumbing capex.
- Market conditions: Rents rising fast (+6.3%/yr); 255 active listings in the ZIP; 7 comparable units currently listed for rent nearby; rentals leasing fast (median 3d on market — plan ~1-2 weeks tenant-placement turnaround); 1,202 units permitted in Ramsey County in 2024 (880 in 5+ unit buildings).
- Ramsey County population projected at +27% by 2050 — long-run rental-demand tailwind backs the buy-and-hold thesis.
- 9 sale attempts since 31y ago with the ask held roughly flat each time — persistent listings suggest the price (not the market) is what's stuck; bring a comps-based counter.
- Current owner paid $39k; list at $230k implies a 489% gain — meaningful room to come down on a strong offer.
- At projected returns (-3.0% appreciation + 6.3% rent growth), your $64k cash investment doubles in ~9 years — after that, you're playing with house money.
- At $2,682/mo this rent would consume 46% of the median local household income ($70k/yr) (locally 2046% of renters already pay >50% of income on rent) — very limited rent-growth headroom before tenants either downsize or default.
Questions for listing agent
- Built in 1915 — when were the roof, HVAC, electrical panel, plumbing, and water heater last replaced?
- Is there a deadline driving the sale (1031 exchange, divorce, estate, relocation)? That informs how much negotiation room exists.
- What's the average days-on-market for RENTAL listings here right now (not sales)? A rising rental-DOM trend means longer vacancies and softer asking-rent achievability than the comps imply.
- What's the recent tenant-quality profile in this submarket — average credit score on applications, eviction rate, late-payment / NSF rate, and stable-employment percentage? A property-management company in the area should have these aggregated.
- How much new for-sale + rental construction is in the pipeline within 1–3 miles? Heavy new supply typically softens prices + rents 12–24 months out; constrained supply supports both.
CashFlowRE · CFR-XNEHTMAEXP1CBD
· Data 3 weeks ago
cashflowre.app · 2026-05-29