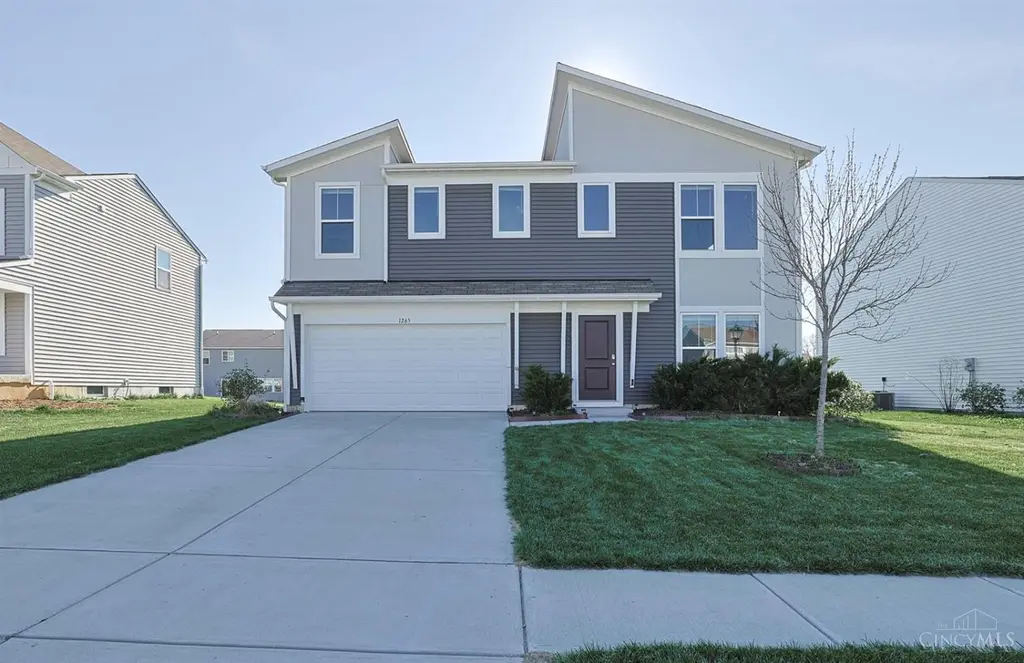
1265 Soaring Way
Maineville, OH 45039
$415,000D+
4 bd · 3.0 ba ·
2,500 sqft ·
Built 2021
· SingleFamily
· Active
· 70 DOM
Cashflow @ list (25.0% down · 7.5%)
Estimated rent
$3,078/mo
Mortgage (P&I)
−$2,176
Tax + insurance
−$689
HOA
−$48
Vac / Maint / Mgmt
−$646
Net cashflow
$-481/mo
Annual
$-5,775/yr
Cap rate
4.90%
Cash-on-cash
-4.97%
DSCR
0.78
1% rule
0.74%
Cash to close
$116,200
Investor read
- This is a 4-bed/3.0-bath single-family listed at $415k.
- At list price, monthly cash flow is $-481 ($-6k/yr) — negative.
- To cash-flow at today's rent, offer at most $330k (20.5% below list).
- To meet the 1% rule (rent ≥ 1% of price), the offer needs to be $308k (25.8% below list).
- It's been on market 70 days — a 6% lower offer ($390k) is reasonable based on typical stale-listing flexibility.
- Recommended offer: $308k (25.8% below list) — sets the bar for 1% rule.
- In year one you build about $44k of equity ($3k loan paydown + $42k appreciation (10.0% local appreciation)).
- Location reads 69/100 on livability (#529 in OH) — a middle-class / working-renter tenant base. Strengths: crime A+, employment A+, cost of living A+; Watch: amenities F, commute F, health & safety F.
- Little Miami Local (rural): math 67% / reading 70% proficiency, ranked #140 of 656 in OH (top 21%) — acceptable for families but not a draw, mixed tenant base, ~2y average lease; only 17% free/reduced lunch — higher-income household profile.
- Market conditions: Rents rising fast (+7.4%/yr); 126 active listings in the ZIP; 7 comparable units currently listed for rent nearby; rentals lingering (median 44d on market — plan ~5-8 weeks vacancy on turnover, expect pricing pressure); 57% of comp listings sitting > 30 days — soft ceiling on asking rent; solid renter incomes; 1,224 units permitted in Warren County in 2024 (474 in 5+ unit buildings).
- Warren County population projected at +16% by 2050 — long-run rental-demand tailwind backs the buy-and-hold thesis.
- 5 sale attempts since 4y ago; this cycle's ask has dropped $25k (6%) from the opening price — seller is motivated, your offer sets the floor, not the list.
- By year 2, paydown + projected appreciation supports a ~$71k cash-out refi (75% LTV) — recoverable capital for the next deal without selling this one.
- Cap rate 4.9% vs local median 3.9% in Maineville — meaningfully above typical; check what's discounted (condition, days-on-market, listing class) to confirm the premium yield is real.
- This rent runs 34% of the median local income ($109k/yr) — at the standard rent-burdened threshold; future hikes will face affordability resistance.
Questions for listing agent
- What do current leases actually rent for vs. the listed asking? Can we see a recent rent roll and the last 12 months of T-12 income?
- It's been on market 70 days. Have you received any prior offers? Is the seller open to a 26% concession, seller financing, or rate buy-down credit?
- What does the HOA fee cover, when was the last increase, and are there any pending special assessments or reserve-fund shortfalls?
- Why hasn't it sold? Are there any deal-killer items the seller is aware of (foundation, flood, title, zoning, code violations)?
- Is there a deadline driving the sale (1031 exchange, divorce, estate, relocation)? That informs how much negotiation room exists.
- Schools are A-rated — typically a magnet for longer-tenancy family renters. What's the average tenant stay here, and is there a school-zone premium baked into asking?
- The area grade is low — what's the realistic commute time and amenity access for the typical tenant pool here? Any planned neighborhood developments (good or bad) we should know about?
- What's the average days-on-market for RENTAL listings here right now (not sales)? A rising rental-DOM trend means longer vacancies and softer asking-rent achievability than the comps imply.
CashFlowRE · CFR-XRN5F0CR0ASAN0
· Data 2 days ago
cashflowre.app · 2026-05-29