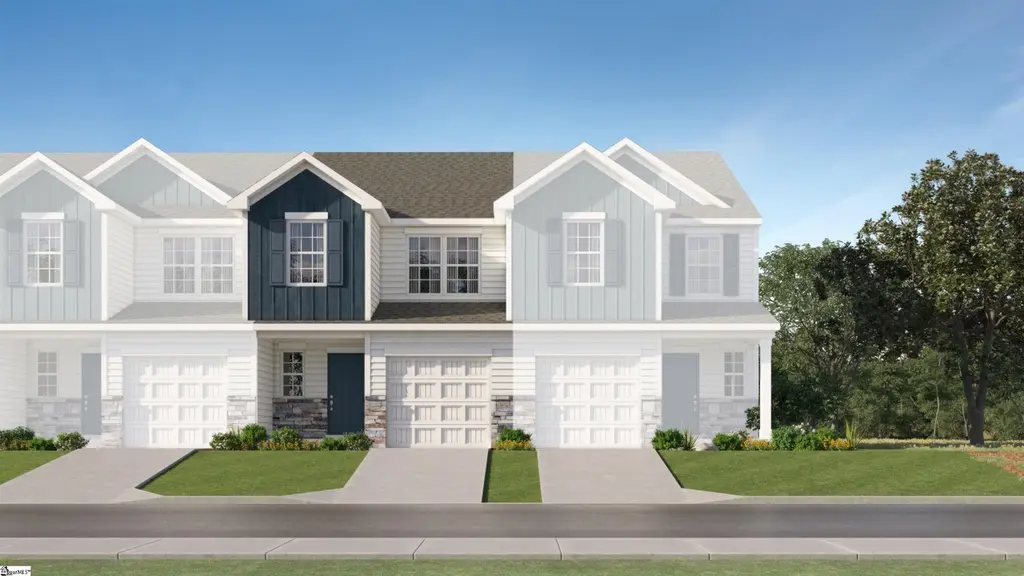
1346 Cattleman Acres Dr Unit MT 35 Magnolia A1
Lyman, SC 29349
$179,999D
3 bd · 2.5 ba ·
1,403 sqft ·
Built 2026
· Townhouse
· Pending
· 13 DOM
Cashflow @ list (25.0% down · 7.5%)
Estimated rent
$1,726/mo
Mortgage (P&I)
−$944
Tax + insurance
−$300
HOA
−$160
Vac / Maint / Mgmt
−$362
Net cashflow
$-41/mo
Annual
$-488/yr
Cap rate
6.02%
Cash-on-cash
-0.97%
DSCR
0.96
1% rule
0.96%
Cash to close
$50,400
Investor read
- This is a 3-bed/2.5-bath townhouse listed at $180k. Condition is rated excellent.
- At list price, monthly cash flow is $-41 ($-488/yr) — negative.
- To cash-flow at today's rent, offer at most $174k (3.3% below list).
- To meet the 1% rule (rent ≥ 1% of price), the offer needs to be $173k (4.1% below list).
- Only 13 days on market — expect competitive offers; lowballing is unlikely to land.
- Recommended offer: $173k (4.1% below list) — sets the bar for 1% rule.
- Local home prices are declining (-3.0%/yr); year-one equity from $1k of loan paydown is wiped out by about $5k of value loss. Plan a longer hold.
- Location reads 68/100 on livability (#83 in SC) — a middle-class / working-renter tenant base. Strengths: cost of living A+, housing A+, crime A-; Watch: amenities F, commute F, health & safety F.
- Spartanburg 01 (rural): math 44% / reading 53% proficiency, ranked #14 of 80 in SC (top 18%) — families likely to look elsewhere, expect single-tenant / working-renter base with shorter leases.
- Zoned schools: Holly Springs-Motlow Elementary (math 46% / reading 52%, grade D, #187 of 597 statewide, top 32%, 534 students, 69% FRL); T.E. Mabry Middle (math 31% / reading 43%, grade F, #97 of 229 statewide, top 42%, 444 students, 73% FRL); Chapman High (math 42% / reading 88%, grade B, #85 of 196 statewide, top 45%, 1,046 students, 59% FRL) — zoned schools average 67% FRL vs 45% district-wide (22 pts higher); higher-poverty schools than district average — tighter screening recommended.
- Market conditions: Rents rising (+1.8%/yr); 700 active listings in the ZIP; solid renter incomes; 3,129 units permitted in Spartanburg County in 2024 (40 in 5+ unit buildings).
- Spartanburg County population projected at +18% by 2050 — long-run rental-demand tailwind backs the buy-and-hold thesis.
- Cap rate 6.0% vs local median 3.6% in Lyman — top-decile yield for the area; either an underpriced asset or a hidden risk that comps aren't pricing in. Stress-test before assuming the spread holds.
Questions for listing agent
- What do current leases actually rent for vs. the listed asking? Can we see a recent rent roll and the last 12 months of T-12 income?
- What does the HOA fee cover, when was the last increase, and are there any pending special assessments or reserve-fund shortfalls?
- Is there a deadline driving the sale (1031 exchange, divorce, estate, relocation)? That informs how much negotiation room exists.
- Schools are D-rated, which usually means shorter tenancies and higher turnover. Who's the typical renter profile here, and what's been the actual vacancy rate?
- The area grade is low — what's the realistic commute time and amenity access for the typical tenant pool here? Any planned neighborhood developments (good or bad) we should know about?
- What's the average days-on-market for RENTAL listings here right now (not sales)? A rising rental-DOM trend means longer vacancies and softer asking-rent achievability than the comps imply.
- What's the recent tenant-quality profile in this submarket — average credit score on applications, eviction rate, late-payment / NSF rate, and stable-employment percentage? A property-management company in the area should have these aggregated.
- How much new for-sale + rental construction is in the pipeline within 1–3 miles? Heavy new supply typically softens prices + rents 12–24 months out; constrained supply supports both.
CashFlowRE · CFR-XVZP9HD1RTNQJV
· Data 1 week ago
cashflowre.app · 2026-05-29