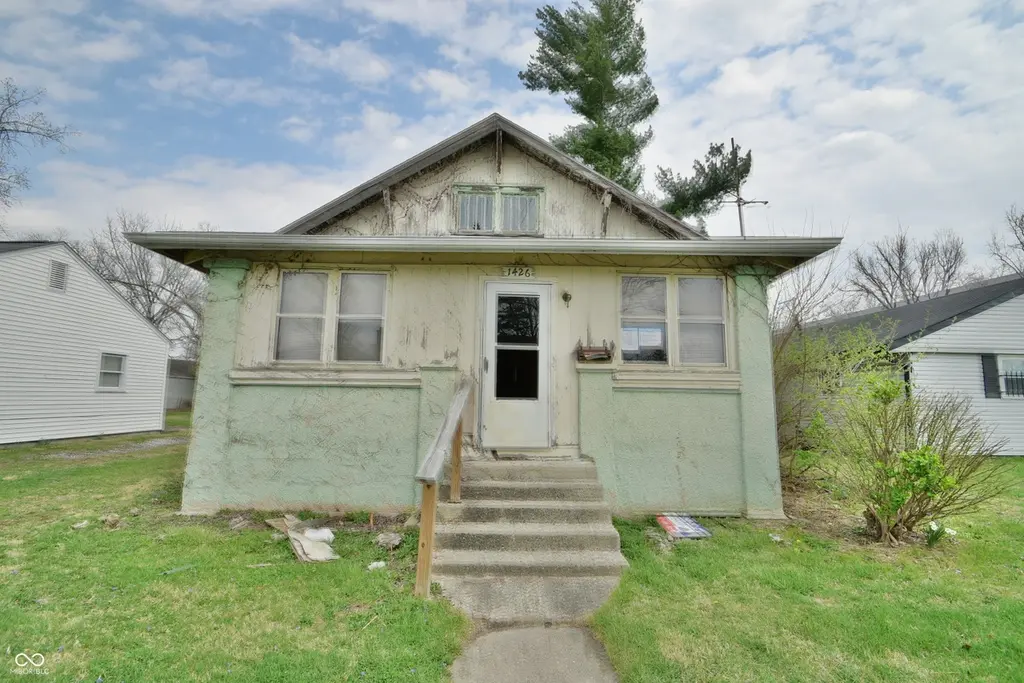
1426 Dewey St
Anderson, IN 46016
$35,000B+
2 bd · 1.0 ba ·
835 sqft ·
Built 1908
· SingleFamily
· Pending
· 49 DOM
Cashflow @ list (25.0% down · 7.5%)
Estimated rent
$954/mo
Mortgage (P&I)
−$184
Tax + insurance
−$124
HOA
−$0
Vac / Maint / Mgmt
−$200
Net cashflow
$446/mo
Annual
$5,353/yr
Cap rate
21.59%
Cash-on-cash
54.62%
DSCR
3.43
1% rule
2.73%
Cash to close
$9,800
Investor read
- This is a 2-bed/1.0-bath single-family listed at $35k.
- At list price, monthly cash flow is $446 ($5k/yr) — positive.
- The deal already cash-flows at list — no discount required.
- Meets the 1% rule at list price ($954 rent vs $35k).
- It's been on market 49 days — a 3% lower offer ($34k) is reasonable based on typical stale-listing flexibility.
- Recommended offer: $34k (3.0% below list) — sets the bar for market timing.
- Local home prices are declining (-3.0%/yr); year-one equity from $242 of loan paydown is wiped out by about $1k of value loss. Plan a longer hold.
- Location reads 60/100 on livability (#521 in IN) — a middle-class / working-renter tenant base. Strengths: cost of living A+, housing A+; Watch: schools F, crime D-, amenities F.
- Anderson Community School Corporation (urban): math 15% / reading 23% proficiency, ranked #280 of 301 in IN (top 93%) — low school quality limits family demand, transient renter base, plan for 1-2y turnover; 70% free/reduced lunch — lower-income household profile, screen leases tightly.
- Watch-outs: property tax is 3.8% of price; built in 1908 — expect roof / HVAC / electrical / plumbing capex.
- Market conditions: Rents rising fast (+7.9%/yr); 188 active listings in the ZIP; 40 comparable units currently listed for rent nearby; rentals at typical pace (median 25d on market — plan ~3-4 weeks tenant-placement turnaround); 48% of comp listings sitting > 30 days — soft ceiling on asking rent; lower-income renter base — watch delinquency; 184 units permitted in Madison County in 2024 (0 in 5+ unit buildings).
- Madison County population projected at -14% by 2050 — secular population decline; favor cash flow + early exit over multi-decade hold.
- At projected returns (-3.0% appreciation + 7.9% rent growth), your $10k cash investment doubles in ~2 years — after that, you're playing with house money.
- Cap rate 21.6% vs local median 6.5% in Anderson — top-decile yield for the area; either an underpriced asset or a hidden risk that comps aren't pricing in. Stress-test before assuming the spread holds.
- This rent runs 32% of the median local income ($36k/yr) — at the standard rent-burdened threshold; future hikes will face affordability resistance.
Questions for listing agent
- It's been on market 49 days. Have you received any prior offers? Is the seller open to a 3% concession, seller financing, or rate buy-down credit?
- Built in 1908 — when were the roof, HVAC, electrical panel, plumbing, and water heater last replaced?
- Property tax is high relative to price — has the assessment been appealed recently, and will the sale trigger a re-assessment?
- Is there a deadline driving the sale (1031 exchange, divorce, estate, relocation)? That informs how much negotiation room exists.
- Schools are F-rated, which usually means shorter tenancies and higher turnover. Who's the typical renter profile here, and what's been the actual vacancy rate?
- Crime grade is D in this area — have there been break-ins, vandalism, or insurance claims at this property in the last 3 years? What carrier currently insures it and at what premium?
- What's the average days-on-market for RENTAL listings here right now (not sales)? A rising rental-DOM trend means longer vacancies and softer asking-rent achievability than the comps imply.
- What's the recent tenant-quality profile in this submarket — average credit score on applications, eviction rate, late-payment / NSF rate, and stable-employment percentage? A property-management company in the area should have these aggregated.
CashFlowRE · CFR-XXVFVPE2QFX0VS
· Data 3 weeks ago
cashflowre.app · 2026-05-29