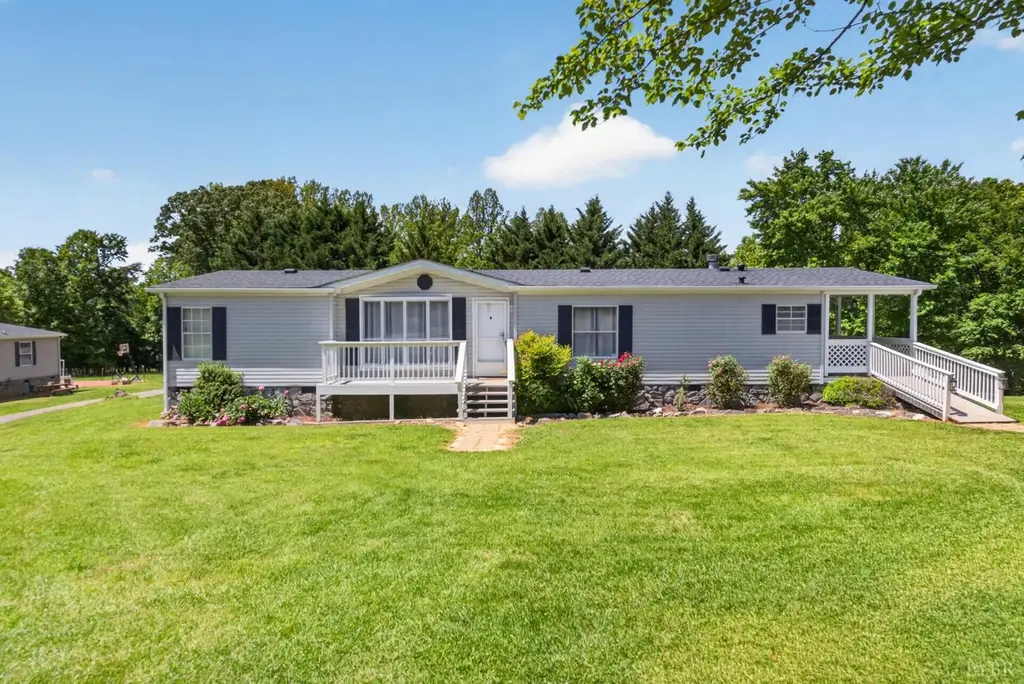
1740 Shiloh Church Rd. Rd
Bedford, VA 24523
$199,900D+
3 bd · 2.0 ba ·
1,496 sqft ·
Built 1994
· SingleFamily
· Pending
· 3 DOM
Cashflow @ list (25.0% down · 7.5%)
Estimated rent
$1,512/mo
Mortgage (P&I)
−$1,048
Tax + insurance
−$125
HOA
−$0
Vac / Maint / Mgmt
−$318
Net cashflow
$22/mo
Annual
$261/yr
Cap rate
6.42%
Cash-on-cash
0.47%
DSCR
1.02
1% rule
0.76%
Cash to close
$55,972
Investor read
- This is a 3-bed/2.0-bath single-family listed at $200k.
- At list price, monthly cash flow is $22 ($261/yr) — positive.
- The deal already cash-flows at list — no discount required.
- To meet the 1% rule (rent ≥ 1% of price), the offer needs to be $151k (24.3% below list).
- Only 3 days on market — expect competitive offers; lowballing is unlikely to land.
- Recommended offer: $151k (24.3% below list) — sets the bar for 1% rule.
- Local home prices are declining (-3.0%/yr); year-one equity from $1k of loan paydown is wiped out by about $6k of value loss. Plan a longer hold.
- Location reads 74/100 on livability (#137 in VA, #4,371 nationally) — a middle-class / working-renter tenant base. Strengths: cost of living A+, health & safety A+, housing A-; Watch: amenities F, commute F, employment D-.
- Bedford County Public School District (rural): math 55% / reading 73% proficiency, ranked #41 of 131 in VA (top 31%) — acceptable for families but not a draw, mixed tenant base, ~2y average lease.
- Zoned schools: Bedford Elementary (math 47% / reading 52%, grade D, #742 of 1,108 statewide, top 70%, 431 students, 85% FRL); Liberty Middle (math 49% / reading 67%, grade B, #174 of 342 statewide, top 51%, 535 students, 86% FRL); Liberty High (math 41% / reading 68%, grade C-, #281 of 319 statewide, top 90%, 726 students, 69% FRL) — zoned schools average 80% FRL vs 30% district-wide (50 pts higher); higher-poverty schools than district average — tighter screening recommended.
- Market conditions: 238 active listings in the ZIP; 294 units permitted in Bedford County in 2024 (0 in 5+ unit buildings).
- Bedford County population projected at +8% by 2050 — modest demand growth; plan on rents tracking national, not racing it.
- 5 sale attempts since 8y ago with the ask held roughly flat each time — persistent listings suggest the price (not the market) is what's stuck; bring a comps-based counter.
- Current owner paid $95k; list at $200k implies a 110% gain — meaningful room to come down on a strong offer.
- Climate carrying-cost: extreme-heat days projected 7→16/yr by 2055 (HVAC capex compounding) — expect insurance premiums to compound above CPI over the hold.
- Cap rate 6.4% vs local median 3.2% in Bedford — top-decile yield for the area; either an underpriced asset or a hidden risk that comps aren't pricing in. Stress-test before assuming the spread holds.
Questions for listing agent
- Is there a deadline driving the sale (1031 exchange, divorce, estate, relocation)? That informs how much negotiation room exists.
- Schools are B-rated — typically a magnet for longer-tenancy family renters. What's the average tenant stay here, and is there a school-zone premium baked into asking?
- The area grade is low — what's the realistic commute time and amenity access for the typical tenant pool here? Any planned neighborhood developments (good or bad) we should know about?
- What's the average days-on-market for RENTAL listings here right now (not sales)? A rising rental-DOM trend means longer vacancies and softer asking-rent achievability than the comps imply.
- What's the recent tenant-quality profile in this submarket — average credit score on applications, eviction rate, late-payment / NSF rate, and stable-employment percentage? A property-management company in the area should have these aggregated.
- How much new for-sale + rental construction is in the pipeline within 1–3 miles? Heavy new supply typically softens prices + rents 12–24 months out; constrained supply supports both.
CashFlowRE · CFR-Y5A1T034S55ZFE
· Data 3 weeks ago
cashflowre.app · 2026-05-29