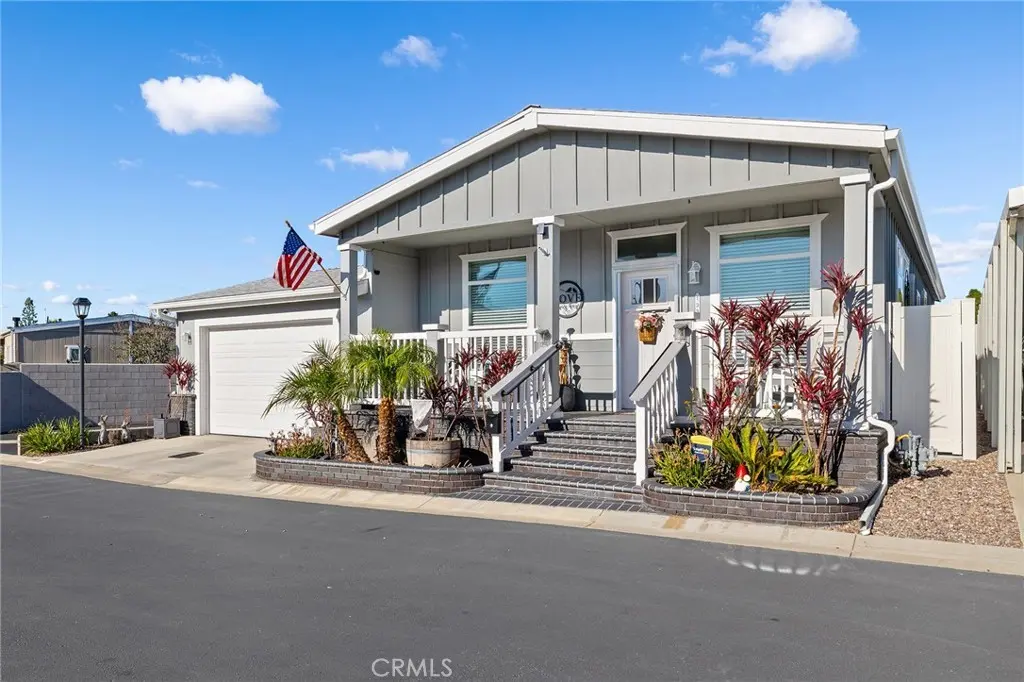
692 Adele St St #133
Orange, CA 92863
$349,000C+
2 bd · 2.0 ba ·
1,440 sqft ·
Built 2022
· Manufactured
· Active
· 49 DOM
Cashflow @ list (25.0% down · 7.5%)
Estimated rent
$3,687/mo
Mortgage (P&I)
−$1,830
Tax + insurance
−$582
HOA
−$0
Vac / Maint / Mgmt
−$774
Net cashflow
$501/mo
Annual
$6,014/yr
Cap rate
8.02%
Cash-on-cash
6.15%
DSCR
1.27
1% rule
1.06%
Cash to close
$97,720
Investor read
- This is a 2-bed/2.0-bath manufactured listed at $349k. Condition is rated good.
- At list price, monthly cash flow is $501 ($6k/yr) — positive.
- The deal already cash-flows at list — no discount required.
- Meets the 1% rule at list price ($4k rent vs $349k).
- It's been on market 49 days — a 3% lower offer ($339k) is reasonable based on typical stale-listing flexibility.
- Recommended offer: $339k (3.0% below list) — sets the bar for market timing.
- In year one you build about $13k of equity ($2k loan paydown + $10k appreciation (3.0% local appreciation)).
- Location reads 73/100 on livability (#172 in CA) — a middle-class / working-renter tenant base. Strengths: amenities A+, employment A+, crime B; Watch: health & safety C-, cost of living F.
- Orange Unified (urban): math 39% / reading 60% proficiency, ranked #127 of 517 in CA (top 25%) — families likely to look elsewhere, expect single-tenant / working-renter base with shorter leases.
- Zoned schools: Handy Elementary (410 students, 92% FRL); Yorba Middle (math 24% / reading 24%, grade F, #277 of 498 statewide, top 73%, 538 students, 91% FRL); Orange High (math 19% / reading 48%, grade F, #656 of 1,170 statewide, top 57%, 1,807 students, 89% FRL) — zoned schools average 90% FRL vs 38% district-wide (52 pts higher); higher-poverty schools than district average — tighter screening recommended.
- Zoned-school proficiency averages 29% at this address vs 50% district-wide (-20 pts) — the specific schools serving this property underperform the Orange Unified average; the district grade overstates school quality for this exact location.
- Market conditions: 2 active listings in the ZIP; 28 comparable units currently listed for rent nearby; rentals leasing fast (median 9d on market — plan ~1-2 weeks tenant-placement turnaround); 6,974 units permitted in Orange County in 2024 (3,839 in 5+ unit buildings).
- Orange County population projected at +14% by 2050 — modest demand growth; plan on rents tracking national, not racing it.
- At projected returns (3.0% appreciation + 3.0% rent growth), your $98k cash investment doubles in ~5 years — after that, you're playing with house money.
- By year 3, paydown + projected appreciation supports a ~$32k cash-out refi (75% LTV) — recoverable capital for the next deal without selling this one.
- Climate carrying-cost: extreme-heat days projected 7→22/yr by 2055 (HVAC capex compounding) — expect insurance premiums to compound above CPI over the hold.
- Cap rate 8.0% vs local median 2.2% in Orange — top-decile yield for the area; either an underpriced asset or a hidden risk that comps aren't pricing in. Stress-test before assuming the spread holds.
Questions for listing agent
- It's been on market 49 days. Have you received any prior offers? Is the seller open to a 3% concession, seller financing, or rate buy-down credit?
- Is there a deadline driving the sale (1031 exchange, divorce, estate, relocation)? That informs how much negotiation room exists.
- What's the average days-on-market for RENTAL listings here right now (not sales)? A rising rental-DOM trend means longer vacancies and softer asking-rent achievability than the comps imply.
- What's the recent tenant-quality profile in this submarket — average credit score on applications, eviction rate, late-payment / NSF rate, and stable-employment percentage? A property-management company in the area should have these aggregated.
- How much new for-sale + rental construction is in the pipeline within 1–3 miles? Heavy new supply typically softens prices + rents 12–24 months out; constrained supply supports both.
CashFlowRE · CFR-Y5KYZKCZ8H1C1Q
· Data 2 weeks ago
cashflowre.app · 2026-05-29