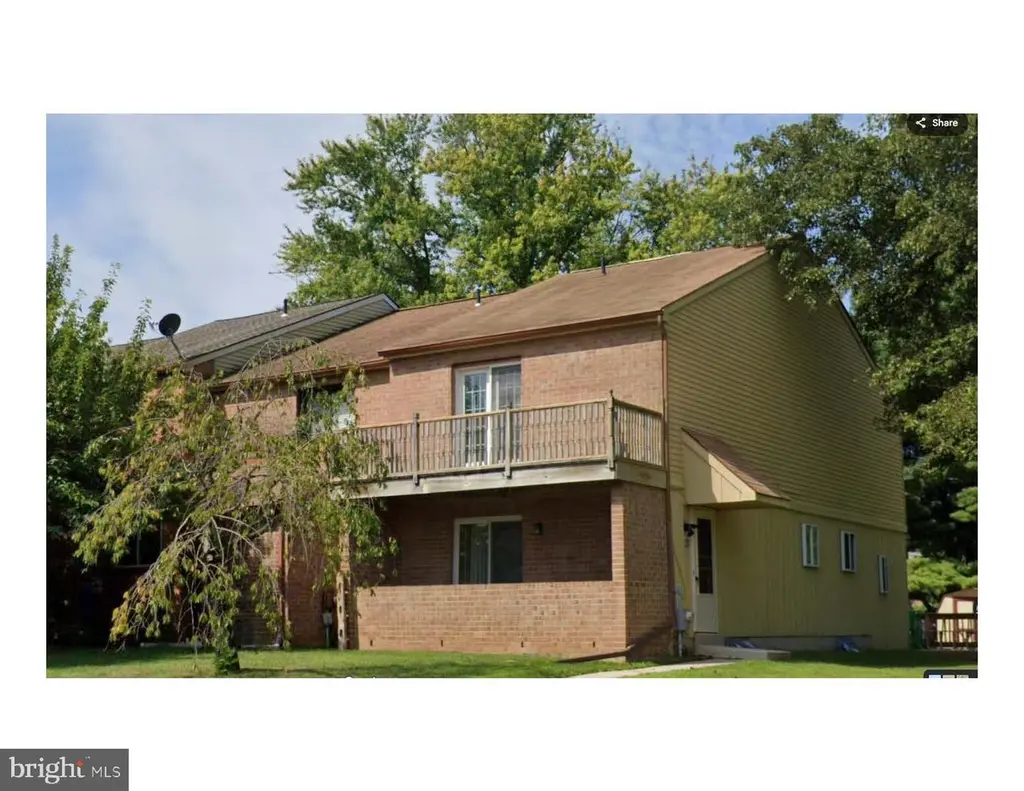
114 Church Rd
Frazer, PA 19355
$365,000D-
3 bd · 2.5 ba ·
1,260 sqft ·
Built 1981
· Townhouse
· Pending
· 1 DOM
Cashflow @ list (25.0% down · 7.5%)
Estimated rent
$2,734/mo
Mortgage (P&I)
−$1,914
Tax + insurance
−$417
HOA
−$0
Vac / Maint / Mgmt
−$574
Net cashflow
$-171/mo
Annual
$-2,051/yr
Cap rate
5.73%
Cash-on-cash
-2.01%
DSCR
0.91
1% rule
0.75%
Cash to close
$102,200
Investor read
- This is a 3-bed/2.5-bath townhouse listed at $365k.
- At list price, monthly cash flow is $-171 ($-2k/yr) — negative.
- To cash-flow at today's rent, offer at most $335k (8.3% below list).
- To meet the 1% rule (rent ≥ 1% of price), the offer needs to be $273k (25.1% below list).
- Only 1 days on market — expect competitive offers; lowballing is unlikely to land.
- Recommended offer: $273k (25.1% below list) — sets the bar for 1% rule.
- Local home prices are declining (-3.0%/yr); year-one equity from $3k of loan paydown is wiped out by about $11k of value loss. Plan a longer hold.
- Location reads: area grade D — affects rentability + tenant quality, not the cash-flow math above.
- Great Valley SD (suburban): math 56% / reading 71% proficiency, ranked #33 of 539 in PA (top 6%) — acceptable for families but not a draw, mixed tenant base, ~2y average lease; only 10% free/reduced lunch — higher-income household profile.
- Market conditions: Rents rising (+2.8%/yr); 168 active listings in the ZIP; 7 comparable units currently listed for rent nearby; rentals at typical pace (median 25d on market — plan ~3-4 weeks tenant-placement turnaround); 43% of comp listings sitting > 30 days — soft ceiling on asking rent; high-income renter base; 1,513 units permitted in Chester County in 2024 (354 in 5+ unit buildings).
- Chester County population projected at +6% by 2050 — modest demand growth; plan on rents tracking national, not racing it.
- 4 sale attempts since 32y ago with the ask held roughly flat each time — persistent listings suggest the price (not the market) is what's stuck; bring a comps-based counter.
- Current owner paid $238k; list at $365k implies a 54% gain — meaningful room to come down on a strong offer.
- Climate carrying-cost: major wind risk, 27% chance of damaging wind over 30y; extreme-heat days projected 7→15/yr by 2055 (HVAC capex compounding) — expect insurance premiums to compound above CPI over the hold.
- Cap rate 5.7% vs local median 2.2% in Frazer — top-decile yield for the area; either an underpriced asset or a hidden risk that comps aren't pricing in. Stress-test before assuming the spread holds.
Questions for listing agent
- What do current leases actually rent for vs. the listed asking? Can we see a recent rent roll and the last 12 months of T-12 income?
- Is there a deadline driving the sale (1031 exchange, divorce, estate, relocation)? That informs how much negotiation room exists.
- The area grade is low — what's the realistic commute time and amenity access for the typical tenant pool here? Any planned neighborhood developments (good or bad) we should know about?
- What's the average days-on-market for RENTAL listings here right now (not sales)? A rising rental-DOM trend means longer vacancies and softer asking-rent achievability than the comps imply.
- What's the recent tenant-quality profile in this submarket — average credit score on applications, eviction rate, late-payment / NSF rate, and stable-employment percentage? A property-management company in the area should have these aggregated.
- How much new for-sale + rental construction is in the pipeline within 1–3 miles? Heavy new supply typically softens prices + rents 12–24 months out; constrained supply supports both.
CashFlowRE · CFR-Y5WR1M8PXAXN12
· Data 3 weeks ago
cashflowre.app · 2026-05-29