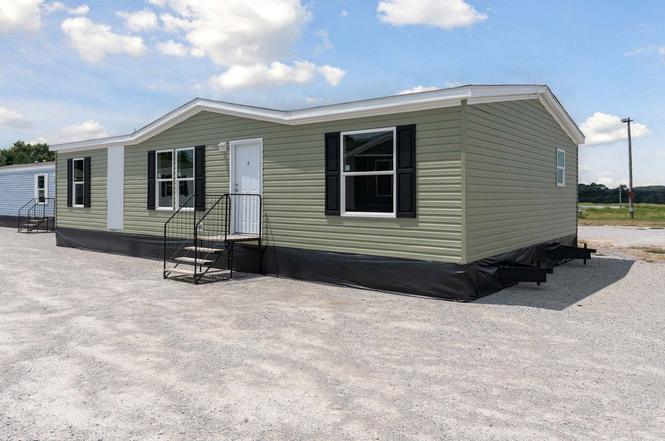
Churchill (Old Hickory) Plan
Nashville-Davidson metropolitan government (balance), TN 37115
$85,995F
3 bd · 2.0 ba ·
1,280 sqft ·
Built —
· Manufactured
· Active
· 323 DOM
Cashflow @ list (25.0% down · 7.5%)
Estimated rent
$1,834/mo
Mortgage (P&I)
−$1,483
Tax + insurance
−$471
HOA
−$700
Vac / Maint / Mgmt
−$385
Net cashflow
$-1,206/mo
Annual
$-14,471/yr
Cap rate
1.18%
Cash-on-cash
-18.27%
DSCR
0.19
1% rule
0.65%
Cash to close
$79,206
Investor read
- This is a 3-bed/2.0-bath manufactured listed at $86k.
- At list price, monthly cash flow is $-1k ($-14k/yr) — negative.
- The deal already cash-flows at list — no discount required.
- Meets the 1% rule at list price ($2k rent vs $86k).
- It's been on market 323 days — a 12% lower offer ($76k) is reasonable based on typical stale-listing flexibility.
- Recommended offer: $76k (12.0% below list) — sets the bar for market timing.
- Local home prices are declining (-3.0%/yr); year-one equity from $2k of loan paydown is wiped out by about $8k of value loss. Plan a longer hold.
- Location reads: area grade F — affects rentability + tenant quality, not the cash-flow math above.
- Davidson County (urban): math 12% / reading 19% proficiency, ranked #126 of 139 in TN (top 91%) — low school quality limits family demand, transient renter base, plan for 1-2y turnover; 66% free/reduced lunch — lower-income household profile, screen leases tightly.
- Zoned schools: Neely'S Bend Elementary (math 8% / reading 17%, grade F, #784 of 952 statewide, top 82%, 368 students, 0% FRL); Haynes Middle (math 0% / reading 3%, grade F, #332 of 333 statewide, top 100%, 291 students, 0% FRL); Hunters Lane High (math 0% / reading 8%, grade F, #321 of 332 statewide, top 97%, 1,466 students, 0% FRL) — zoned schools average 0% FRL vs 66% district-wide (66 pts lower); this property's tenant base skews higher-income than the district average.
- Watch-outs: property tax is 4.9% of price; HOA is 38% of rent.
- Market conditions: Rents soft (-0.9%/yr); 338 active listings in the ZIP; 25 comparable units currently listed for rent nearby; rentals at typical pace (median 25d on market — plan ~3-4 weeks tenant-placement turnaround); 6,873 units permitted in Davidson County in 2024 (4,138 in 5+ unit buildings).
- Davidson County population projected at +42% by 2050 — long-run rental-demand tailwind backs the buy-and-hold thesis.
- Cap rate 1.2% vs local median 2.9% in Nashville-Davidson metropolitan government (balance) — below-typical yield; the buyer is paying a premium for something (appreciation thesis, condition, location) that the cap rate doesn't capture.
- This rent runs 40% of the median local income ($55k/yr) — at the standard rent-burdened threshold; future hikes will face affordability resistance.
Questions for listing agent
- What do current leases actually rent for vs. the listed asking? Can we see a recent rent roll and the last 12 months of T-12 income?
- It's been on market 323 days. Have you received any prior offers? Is the seller open to a 12% concession, seller financing, or rate buy-down credit?
- Property tax is high relative to price — has the assessment been appealed recently, and will the sale trigger a re-assessment?
- What does the HOA fee cover, when was the last increase, and are there any pending special assessments or reserve-fund shortfalls?
- Why hasn't it sold? Are there any deal-killer items the seller is aware of (foundation, flood, title, zoning, code violations)?
- Is there a deadline driving the sale (1031 exchange, divorce, estate, relocation)? That informs how much negotiation room exists.
- The area grade is low — what's the realistic commute time and amenity access for the typical tenant pool here? Any planned neighborhood developments (good or bad) we should know about?
- What's the average days-on-market for RENTAL listings here right now (not sales)? A rising rental-DOM trend means longer vacancies and softer asking-rent achievability than the comps imply.
CashFlowRE · CFR-Y5X6KPDEM5TX97
· Data 20 h ago
cashflowre.app · 2026-05-29