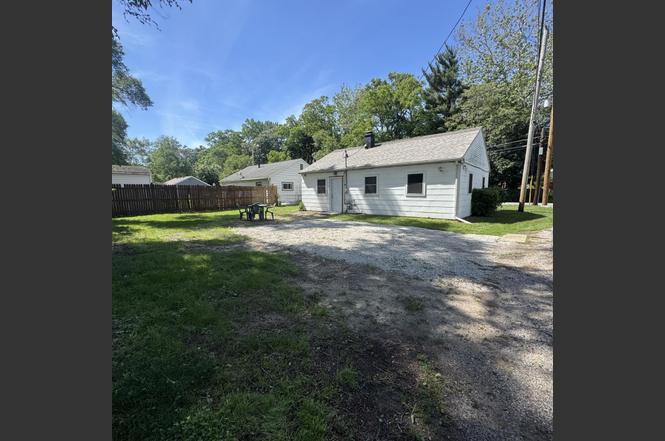
1305 Springland Ave
Michigan City, IN 46360
$138,900D
2 bd · 1.0 ba ·
825 sqft ·
Built 1949
· SingleFamily
· Active
· 3 DOM
Cashflow @ list (25.0% down · 7.5%)
Estimated rent
$1,273/mo
Mortgage (P&I)
−$728
Tax + insurance
−$133
HOA
−$0
Vac / Maint / Mgmt
−$267
Net cashflow
$145/mo
Annual
$1,735/yr
Cap rate
7.54%
Cash-on-cash
4.46%
DSCR
1.20
1% rule
0.92%
Cash to close
$38,892
Investor read
- This is a 2-bed/1.0-bath single-family listed at $139k.
- At list price, monthly cash flow is $145 ($2k/yr) — positive.
- The deal already cash-flows at list — no discount required.
- To meet the 1% rule (rent ≥ 1% of price), the offer needs to be $127k (8.4% below list).
- Only 3 days on market — expect competitive offers; lowballing is unlikely to land.
- Recommended offer: $127k (8.4% below list) — sets the bar for 1% rule.
- Local home prices are declining (-3.0%/yr); year-one equity from $960 of loan paydown is wiped out by about $4k of value loss. Plan a longer hold.
- Location reads 81/100 on livability (#15 in IN, #1,317 nationally) — a professional / high-income tenant draw. Strengths: commute A+, cost of living A+, housing A+; Watch: employment D, schools D-, amenities D-.
- Michigan City Area Schools (urban): math 23% / reading 28% proficiency, ranked #262 of 301 in IN (top 87%) — low school quality limits family demand, transient renter base, plan for 1-2y turnover; 68% free/reduced lunch — lower-income household profile, screen leases tightly.
- Watch-outs: built in 1949 — expect roof / HVAC / electrical / plumbing capex.
- Market conditions: Rents rising fast (+9.7%/yr); 371 active listings in the ZIP; 11 comparable units currently listed for rent nearby; rentals lingering (median 44d on market — plan ~5-8 weeks vacancy on turnover, expect pricing pressure); 100% of comp listings sitting > 30 days — soft ceiling on asking rent; 216 units permitted in LaPorte County in 2024 (75 in 5+ unit buildings).
- LaPorte County population projected to shrink 7% by 2050 — rents likely to lag national; underwrite the cash flow, not the appreciation.
- 2 sale attempts since 12y ago with the ask held roughly flat each time — persistent listings suggest the price (not the market) is what's stuck; bring a comps-based counter.
- At projected returns (-3.0% appreciation + 8.0% rent growth), your $39k cash investment doubles in ~10 years — after that, you're playing with house money.
- Cap rate 7.5% vs local median 2.7% in Michigan City — top-decile yield for the area; either an underpriced asset or a hidden risk that comps aren't pricing in. Stress-test before assuming the spread holds.
Questions for listing agent
- Built in 1949 — when were the roof, HVAC, electrical panel, plumbing, and water heater last replaced?
- Is there a deadline driving the sale (1031 exchange, divorce, estate, relocation)? That informs how much negotiation room exists.
- Schools are D-rated, which usually means shorter tenancies and higher turnover. Who's the typical renter profile here, and what's been the actual vacancy rate?
- The area grade is low — what's the realistic commute time and amenity access for the typical tenant pool here? Any planned neighborhood developments (good or bad) we should know about?
- What's the average days-on-market for RENTAL listings here right now (not sales)? A rising rental-DOM trend means longer vacancies and softer asking-rent achievability than the comps imply.
- What's the recent tenant-quality profile in this submarket — average credit score on applications, eviction rate, late-payment / NSF rate, and stable-employment percentage? A property-management company in the area should have these aggregated.
- How much new for-sale + rental construction is in the pipeline within 1–3 miles? Heavy new supply typically softens prices + rents 12–24 months out; constrained supply supports both.
CashFlowRE · CFR-Y6BA6S53DSD54V
· Data 1 day ago
cashflowre.app · 2026-05-29