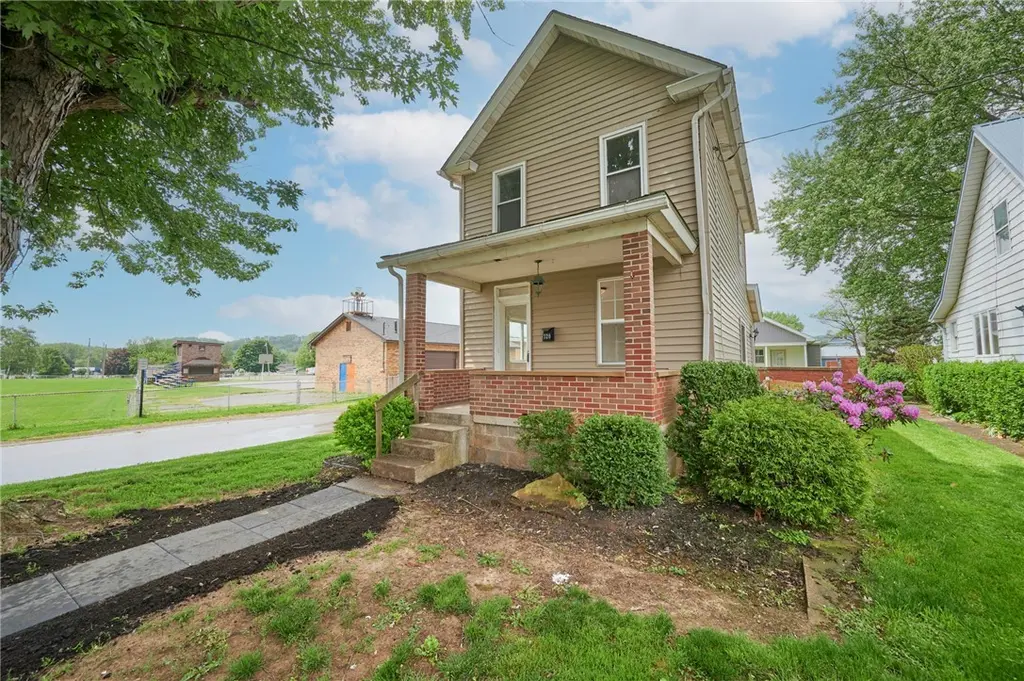
328 Cleveland St
West Kittanning, PA 16201
$129,900D
2 bd · 1.0 ba ·
992 sqft ·
Built 1928
· SingleFamily
· Active
· 31 DOM
Cashflow @ list (25.0% down · 7.5%)
Estimated rent
$904/mo
Mortgage (P&I)
−$681
Tax + insurance
−$175
HOA
−$0
Vac / Maint / Mgmt
−$190
Net cashflow
$-142/mo
Annual
$-1,700/yr
Cap rate
4.98%
Cash-on-cash
-4.67%
DSCR
0.79
1% rule
0.70%
Cash to close
$36,372
Investor read
- This is a 2-bed/1.0-bath single-family listed at $130k.
- At list price, monthly cash flow is $-142 ($-2k/yr) — negative.
- To cash-flow at today's rent, offer at most $105k (19.3% below list).
- To meet the 1% rule (rent ≥ 1% of price), the offer needs to be $90k (30.4% below list).
- It's been on market 31 days — a 3% lower offer ($126k) is reasonable based on typical stale-listing flexibility.
- Recommended offer: $90k (30.4% below list) — sets the bar for 1% rule.
- In year one you build about $14k of equity ($898 loan paydown + $13k appreciation (10.0% local appreciation)).
- Location reads 78/100 on livability (#296 in PA, #2,630 nationally) — a middle-class / working-renter tenant base. Strengths: crime A+, cost of living A+, housing A+; Watch: employment D, amenities F, commute F.
- Armstrong SD (rural): math 38% / reading 58% proficiency, ranked #233 of 539 in PA (top 43%) — families likely to look elsewhere, expect single-tenant / working-renter base with shorter leases.
- Zoned schools: West Hills Primary Sch (math 52% / reading 62%, grade C+, #444 of 1,518 statewide, top 32%, 548 students, 100% FRL); West Hills Intermediate Sch (math 37% / reading 59%, grade C-, #153 of 512 statewide, top 30%, 475 students, 100% FRL); Armstrong Jshs (math 37% / reading 55%, grade D-, #178 of 437 statewide, top 42%, 1,478 students, 100% FRL) — zoned schools average 100% FRL vs 37% district-wide (63 pts higher); higher-poverty schools than district average — tighter screening recommended.
- Watch-outs: built in 1928 — expect roof / HVAC / electrical / plumbing capex.
- Market conditions: 31 active listings in the ZIP; 58 units permitted in Armstrong County in 2024 (20 in 5+ unit buildings).
- Armstrong County population projected at -27% by 2050 — secular population decline; favor cash flow + early exit over multi-decade hold.
- 8 sale attempts since 10y ago with the ask held roughly flat each time — persistent listings suggest the price (not the market) is what's stuck; bring a comps-based counter.
- Current owner paid $11k; list at $130k implies a 1047% gain — meaningful room to come down on a strong offer.
- By year 3, paydown + projected appreciation supports a ~$35k cash-out refi (75% LTV) — recoverable capital for the next deal without selling this one.
Questions for listing agent
- What do current leases actually rent for vs. the listed asking? Can we see a recent rent roll and the last 12 months of T-12 income?
- It's been on market 31 days. Have you received any prior offers? Is the seller open to a 30% concession, seller financing, or rate buy-down credit?
- Built in 1928 — when were the roof, HVAC, electrical panel, plumbing, and water heater last replaced?
- Is there a deadline driving the sale (1031 exchange, divorce, estate, relocation)? That informs how much negotiation room exists.
- The area grade is low — what's the realistic commute time and amenity access for the typical tenant pool here? Any planned neighborhood developments (good or bad) we should know about?
- What's the average days-on-market for RENTAL listings here right now (not sales)? A rising rental-DOM trend means longer vacancies and softer asking-rent achievability than the comps imply.
- What's the recent tenant-quality profile in this submarket — average credit score on applications, eviction rate, late-payment / NSF rate, and stable-employment percentage? A property-management company in the area should have these aggregated.
- How much new for-sale + rental construction is in the pipeline within 1–3 miles? Heavy new supply typically softens prices + rents 12–24 months out; constrained supply supports both.
CashFlowRE · CFR-Y80AKVA30QAJMC
· Data 7 h ago
cashflowre.app · 2026-05-29