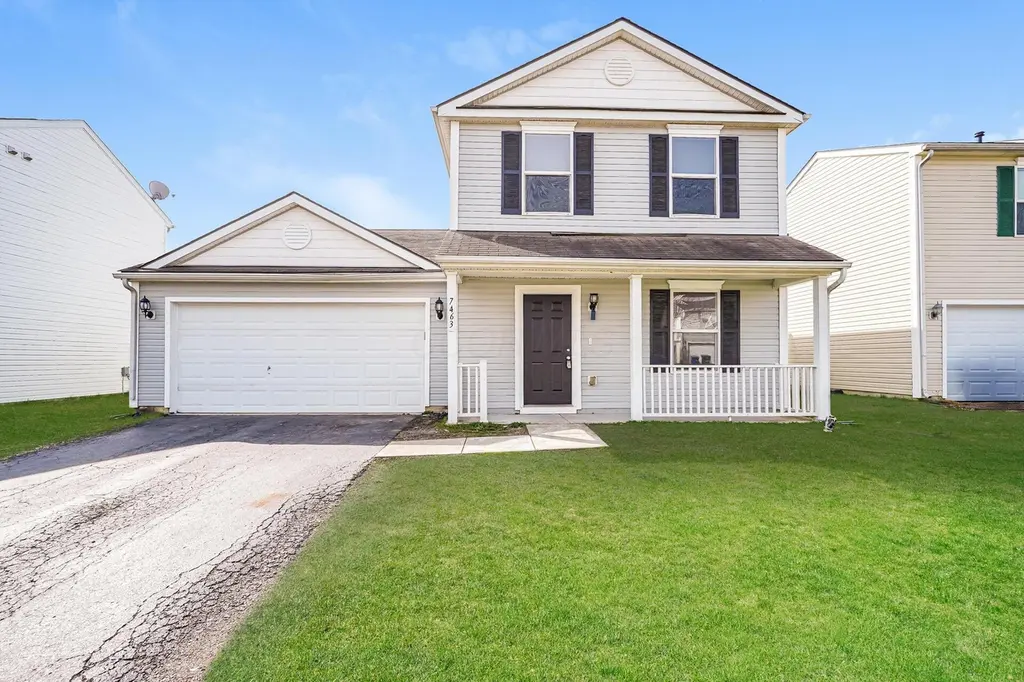
7463 Canal Highlands Blvd
Columbus, OH 43110
$279,900C-
3 bd · 2.5 ba ·
2,120 sqft ·
Built 2004
· SingleFamily
· Pending
· 91 DOM
Cashflow @ list (25.0% down · 7.5%)
Estimated rent
$2,571/mo
Mortgage (P&I)
−$1,468
Tax + insurance
−$536
HOA
−$6
Vac / Maint / Mgmt
−$540
Net cashflow
$21/mo
Annual
$252/yr
Cap rate
6.38%
Cash-on-cash
0.32%
DSCR
1.01
1% rule
0.92%
Cash to close
$78,372
Investor read
- This is a 3-bed/2.5-bath single-family listed at $280k.
- At list price, monthly cash flow is $21 ($252/yr) — positive.
- The deal already cash-flows at list — no discount required.
- To meet the 1% rule (rent ≥ 1% of price), the offer needs to be $257k (8.1% below list).
- It's been on market 91 days — a 9% lower offer ($255k) is reasonable based on typical stale-listing flexibility.
- Recommended offer: $255k (9.0% below list) — sets the bar for market timing.
- Local home prices are declining (-3.0%/yr); year-one equity from $2k of loan paydown is wiped out by about $8k of value loss. Plan a longer hold.
- Location reads 81/100 on livability (#97 in OH, #1,491 nationally) — a professional / high-income tenant draw. Strengths: commute A+, cost of living A+, housing A+; Watch: employment C-, crime F.
- Canal Winchester Local (rural): math 50% / reading 63% proficiency, ranked #306 of 656 in OH (top 47%) — acceptable for families but not a draw, mixed tenant base, ~2y average lease.
- Market conditions: Rents soft (-0.5%/yr); 208 active listings in the ZIP; 5 comparable units currently listed for rent nearby; rentals leasing fast (median 5d on market — plan ~1-2 weeks tenant-placement turnaround); solid renter incomes; 8,139 units permitted in Franklin County in 2024 (5,940 in 5+ unit buildings).
- Franklin County population projected at +34% by 2050 — long-run rental-demand tailwind backs the buy-and-hold thesis.
- Cap rate 6.4% vs local median 3.8% in Columbus — top-decile yield for the area; either an underpriced asset or a hidden risk that comps aren't pricing in. Stress-test before assuming the spread holds.
- This rent runs 40% of the median local income ($77k/yr) — at the standard rent-burdened threshold; future hikes will face affordability resistance.
Questions for listing agent
- It's been on market 91 days. Have you received any prior offers? Is the seller open to a 9% concession, seller financing, or rate buy-down credit?
- What does the HOA fee cover, when was the last increase, and are there any pending special assessments or reserve-fund shortfalls?
- Why hasn't it sold? Are there any deal-killer items the seller is aware of (foundation, flood, title, zoning, code violations)?
- Is there a deadline driving the sale (1031 exchange, divorce, estate, relocation)? That informs how much negotiation room exists.
- Crime grade is F in this area — have there been break-ins, vandalism, or insurance claims at this property in the last 3 years? What carrier currently insures it and at what premium?
- What's the average days-on-market for RENTAL listings here right now (not sales)? A rising rental-DOM trend means longer vacancies and softer asking-rent achievability than the comps imply.
- What's the recent tenant-quality profile in this submarket — average credit score on applications, eviction rate, late-payment / NSF rate, and stable-employment percentage? A property-management company in the area should have these aggregated.
- How much new for-sale + rental construction is in the pipeline within 1–3 miles? Heavy new supply typically softens prices + rents 12–24 months out; constrained supply supports both.
CashFlowRE · CFR-Y9F3D35HCNCD82
· Data 3 weeks ago
cashflowre.app · 2026-05-29