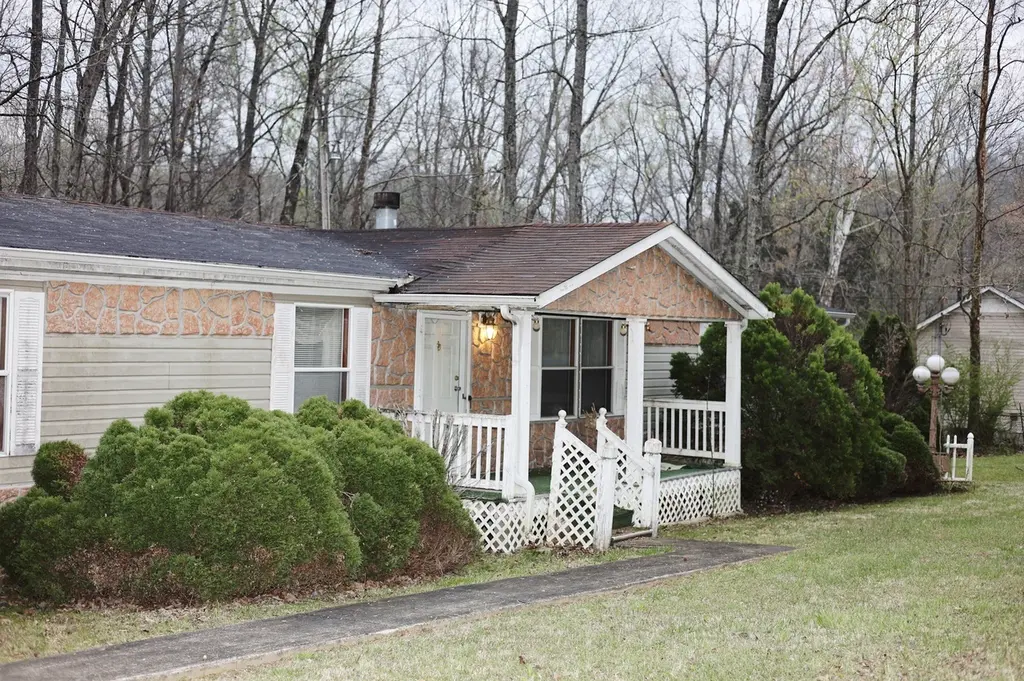
1050 Macon Wall Rd
Ashland City, TN 37015
$150,000B
4 bd · 2.0 ba ·
1,542 sqft ·
Built 1966
· Manufactured
· Pending
· 35 DOM
Cashflow @ list (25.0% down · 7.5%)
Estimated rent
$2,067/mo
Mortgage (P&I)
−$787
Tax + insurance
−$104
HOA
−$0
Vac / Maint / Mgmt
−$434
Net cashflow
$742/mo
Annual
$8,909/yr
Cap rate
12.23%
Cash-on-cash
21.21%
DSCR
1.94
1% rule
1.38%
Cash to close
$42,000
Investor read
- This is a 4-bed/2.0-bath manufactured listed at $150k.
- At list price, monthly cash flow is $742 ($9k/yr) — positive.
- The deal already cash-flows at list — no discount required.
- Meets the 1% rule at list price ($2k rent vs $150k).
- It's been on market 35 days — a 3% lower offer ($146k) is reasonable based on typical stale-listing flexibility.
- Recommended offer: $146k (3.0% below list) — sets the bar for market timing.
- Local home prices are declining (-3.0%/yr); year-one equity from $1k of loan paydown is wiped out by about $4k of value loss. Plan a longer hold.
- Location reads 65/100 on livability (#138 in TN) — a middle-class / working-renter tenant base. Strengths: crime A+, cost of living A+, housing A+; Watch: amenities F, commute F, health & safety F.
- Cheatham County (rural): math 24% / reading 28% proficiency, ranked #74 of 139 in TN (top 53%) — low school quality limits family demand, transient renter base, plan for 1-2y turnover.
- Zoned schools: East Cheatham Elementary (math 32% / reading 27%, grade F, #423 of 952 statewide, top 48%, 393 students, 0% FRL); Cheatham Co Central (math 2% / reading 32%, grade F, #215 of 332 statewide, top 67%, 581 students, 0% FRL) — zoned schools average 0% FRL vs 40% district-wide (40 pts lower); this property's tenant base skews higher-income than the district average.
- Market conditions: Rents rising (+2.1%/yr); 167 active listings in the ZIP; 1 comparable units currently listed for rent nearby; solid renter incomes; 271 units permitted in Cheatham County in 2024 (0 in 5+ unit buildings).
- 2 sale attempts; this cycle's ask has dropped $120k (44%) from the opening price — seller is motivated, your offer sets the floor, not the list.
- At projected returns (-3.0% appreciation + 2.1% rent growth), your $42k cash investment doubles in ~7 years — after that, you're playing with house money.
- Climate carrying-cost: moderate flood risk; extreme-heat days projected 7→18/yr by 2055 (HVAC capex compounding) — expect insurance premiums to compound above CPI over the hold.
- Cap rate 12.2% vs local median 3.5% in Ashland City — top-decile yield for the area; either an underpriced asset or a hidden risk that comps aren't pricing in. Stress-test before assuming the spread holds.
- This rent runs 31% of the median local income ($79k/yr) — at the standard rent-burdened threshold; future hikes will face affordability resistance.
Questions for listing agent
- It's been on market 35 days. Have you received any prior offers? Is the seller open to a 3% concession, seller financing, or rate buy-down credit?
- Built in 1966 — when were the roof, HVAC, electrical panel, plumbing, and water heater last replaced?
- Is there a deadline driving the sale (1031 exchange, divorce, estate, relocation)? That informs how much negotiation room exists.
- Schools are F-rated, which usually means shorter tenancies and higher turnover. Who's the typical renter profile here, and what's been the actual vacancy rate?
- What's the average days-on-market for RENTAL listings here right now (not sales)? A rising rental-DOM trend means longer vacancies and softer asking-rent achievability than the comps imply.
- What's the recent tenant-quality profile in this submarket — average credit score on applications, eviction rate, late-payment / NSF rate, and stable-employment percentage? A property-management company in the area should have these aggregated.
- How much new for-sale + rental construction is in the pipeline within 1–3 miles? Heavy new supply typically softens prices + rents 12–24 months out; constrained supply supports both.
CashFlowRE · CFR-YB94D696X8MEGB
· Data 1 week ago
cashflowre.app · 2026-05-29