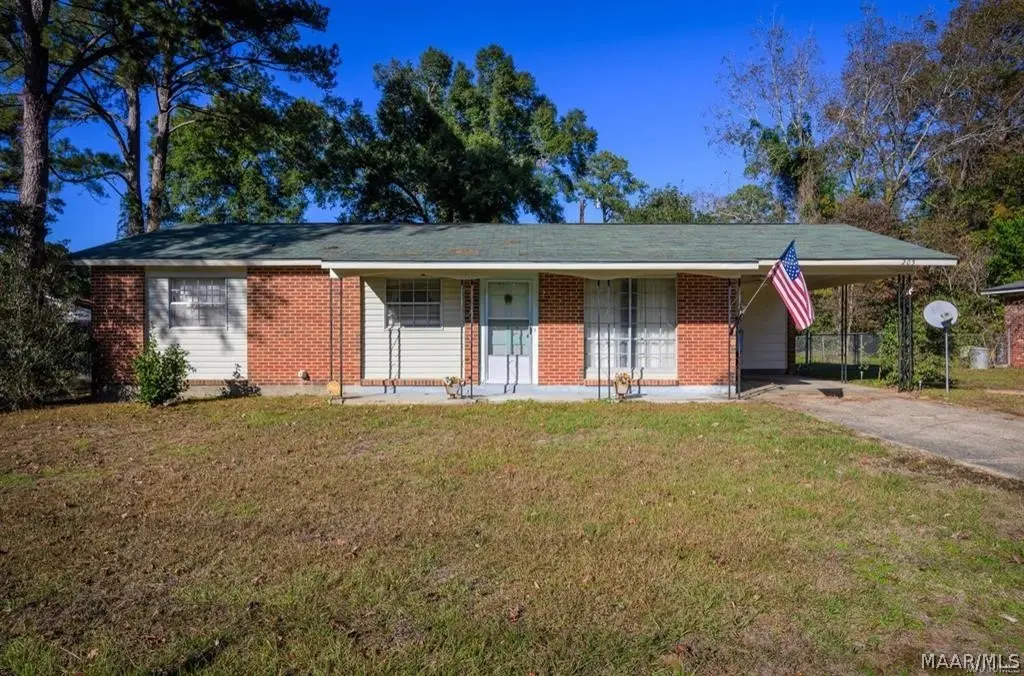
205 9th Ave
Selma, AL 36701
$75,000C-
3 bd · 1.0 ba ·
1,043 sqft ·
Built 1965
· SingleFamily
· Active
· 22 DOM
Cashflow @ list (25.0% down · 7.5%)
Estimated rent
$929/mo
Mortgage (P&I)
−$393
Tax + insurance
−$125
HOA
−$0
Vac / Maint / Mgmt
−$195
Net cashflow
$216/mo
Annual
$2,587/yr
Cap rate
9.74%
Cash-on-cash
12.32%
DSCR
1.55
1% rule
1.24%
Cash to close
$21,000
Investor read
- This is a 3-bed/1.0-bath single-family listed at $75k.
- At list price, monthly cash flow is $216 ($3k/yr) — positive.
- The deal already cash-flows at list — no discount required.
- Meets the 1% rule at list price ($929 rent vs $75k).
- It's been on market 22 days — a 2% lower offer ($74k) is reasonable based on typical stale-listing flexibility.
- Recommended offer: $74k (1.5% below list) — sets the bar for market timing.
- Local home prices are declining (-3.0%/yr); year-one equity from $519 of loan paydown is wiped out by about $2k of value loss. Plan a longer hold.
- Location reads 56/100 on livability (#407 in AL) — a working-class tenant base; expect higher turnover. Strengths: cost of living A+, housing B; Watch: schools F, crime F, amenities F.
- Selma City (town): math 2% / reading 23% proficiency, ranked #118 of 129 in AL (top 92%) — low school quality limits family demand, transient renter base, plan for 1-2y turnover; 84% free/reduced lunch — lower-income household profile, screen leases tightly.
- Market conditions: 104 active listings in the ZIP; 1 comparable units currently listed for rent nearby; 7 units permitted in Dallas County in 2024 (0 in 5+ unit buildings).
- Dallas County population projected at -36% by 2050 — secular population decline; favor cash flow + early exit over multi-decade hold.
- 4 sale attempts since 4y ago; this cycle's ask has dropped $10k (12%) from the opening price — seller is motivated, your offer sets the floor, not the list.
- At projected returns (-3.0% appreciation + 3.0% rent growth), your $21k cash investment doubles in ~10 years — after that, you're playing with house money.
- Climate carrying-cost: severe wind risk, 80% chance of damaging wind over 30y; extreme-heat days projected 7→20/yr by 2055 (HVAC capex compounding) — expect insurance premiums to compound above CPI over the hold.
- Cap rate 9.7% vs local median 7.5% in Selma — meaningfully above typical; check what's discounted (condition, days-on-market, listing class) to confirm the premium yield is real.
Questions for listing agent
- Built in 1965 — when were the roof, HVAC, electrical panel, plumbing, and water heater last replaced?
- Is there a deadline driving the sale (1031 exchange, divorce, estate, relocation)? That informs how much negotiation room exists.
- Schools are F-rated, which usually means shorter tenancies and higher turnover. Who's the typical renter profile here, and what's been the actual vacancy rate?
- Crime grade is F in this area — have there been break-ins, vandalism, or insurance claims at this property in the last 3 years? What carrier currently insures it and at what premium?
- What's the average days-on-market for RENTAL listings here right now (not sales)? A rising rental-DOM trend means longer vacancies and softer asking-rent achievability than the comps imply.
- What's the recent tenant-quality profile in this submarket — average credit score on applications, eviction rate, late-payment / NSF rate, and stable-employment percentage? A property-management company in the area should have these aggregated.
- How much new for-sale + rental construction is in the pipeline within 1–3 miles? Heavy new supply typically softens prices + rents 12–24 months out; constrained supply supports both.
CashFlowRE · CFR-YCTEAYEK94TPYA
· Data 1 day ago
cashflowre.app · 2026-05-29