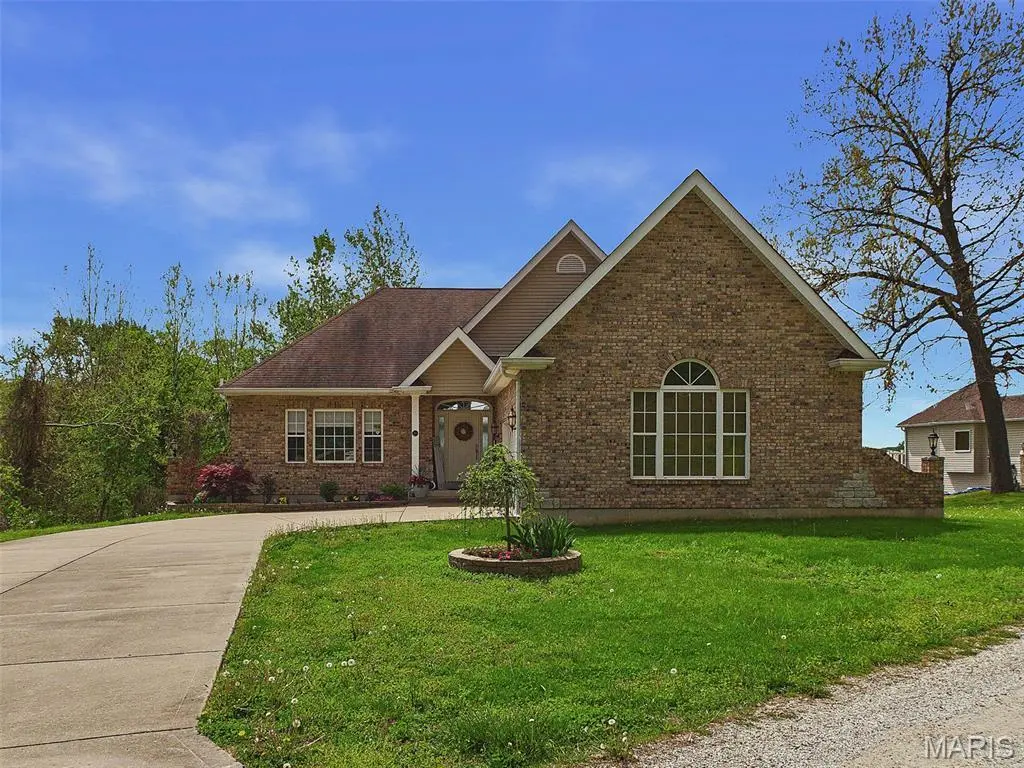
25 Brickyard Dr
St. Peters, MO 62036
$284,900D+
3 bd · 3.0 ba ·
2,937 sqft ·
Built 2007
· SingleFamily
· Active
· 67 DOM
Cashflow @ list (25.0% down · 7.5%)
Estimated rent
$2,900/mo
Mortgage (P&I)
−$1,494
Tax + insurance
−$553
HOA
−$315
Vac / Maint / Mgmt
−$609
Net cashflow
$-71/mo
Annual
$-852/yr
Cap rate
5.99%
Cash-on-cash
-1.07%
DSCR
0.95
1% rule
1.02%
Cash to close
$79,772
Investor read
- This is a 3-bed/3.0-bath single-family listed at $285k.
- At list price, monthly cash flow is $-71 ($-852/yr) — negative.
- To cash-flow at today's rent, offer at most $272k (4.4% below list).
- Meets the 1% rule at list price ($3k rent vs $285k).
- It's been on market 67 days — a 6% lower offer ($268k) is reasonable based on typical stale-listing flexibility.
- Recommended offer: $268k (6.0% below list) — sets the bar for market timing.
- In year one you build about $11k of equity ($2k loan paydown + $9k appreciation (3.0% local appreciation)).
- Location reads: area grade D — affects rentability + tenant quality, not the cash-flow math above.
- Brussels CUSD 42 (rural): math 30% / reading 30% proficiency, ranked #479 of 919 in IL (top 52%) — families likely to look elsewhere, expect single-tenant / working-renter base with shorter leases.
- Zoned schools: Brussels Grade School (math 10% / reading 50%, grade F, #656 of 2,056 statewide, top 32%, 40 students, 0% FRL); Brussels High School (math 30% / reading 10%, grade F, #357 of 693 statewide, top 54%, 57 students, 0% FRL) — zoned schools average 0% FRL vs 35% district-wide (35 pts lower); this property's tenant base skews higher-income than the district average.
- Market conditions: 1 comparable units currently listed for rent nearby; 11 units permitted in Calhoun County in 2024 (0 in 5+ unit buildings).
- Calhoun County population projected at -34% by 2050 — secular population decline; favor cash flow + early exit over multi-decade hold.
- 3 sale attempts since 3y ago with the ask held roughly flat each time — persistent listings suggest the price (not the market) is what's stuck; bring a comps-based counter.
- At projected returns (3.0% appreciation + 3.0% rent growth), your $80k cash investment doubles in ~7 years — after that, you're playing with house money.
- By year 4, paydown + projected appreciation supports a ~$36k cash-out refi (75% LTV) — recoverable capital for the next deal without selling this one.
- Cap rate 6.0% vs local median 4.2% in St. Peters — top-decile yield for the area; either an underpriced asset or a hidden risk that comps aren't pricing in. Stress-test before assuming the spread holds.
Questions for listing agent
- What do current leases actually rent for vs. the listed asking? Can we see a recent rent roll and the last 12 months of T-12 income?
- It's been on market 67 days. Have you received any prior offers? Is the seller open to a 6% concession, seller financing, or rate buy-down credit?
- What does the HOA fee cover, when was the last increase, and are there any pending special assessments or reserve-fund shortfalls?
- Why hasn't it sold? Are there any deal-killer items the seller is aware of (foundation, flood, title, zoning, code violations)?
- Is there a deadline driving the sale (1031 exchange, divorce, estate, relocation)? That informs how much negotiation room exists.
- The area grade is low — what's the realistic commute time and amenity access for the typical tenant pool here? Any planned neighborhood developments (good or bad) we should know about?
- What's the average days-on-market for RENTAL listings here right now (not sales)? A rising rental-DOM trend means longer vacancies and softer asking-rent achievability than the comps imply.
- What's the recent tenant-quality profile in this submarket — average credit score on applications, eviction rate, late-payment / NSF rate, and stable-employment percentage? A property-management company in the area should have these aggregated.
CashFlowRE · CFR-YDE7EY07AQ3HHX
· Data 22 h ago
cashflowre.app · 2026-05-29