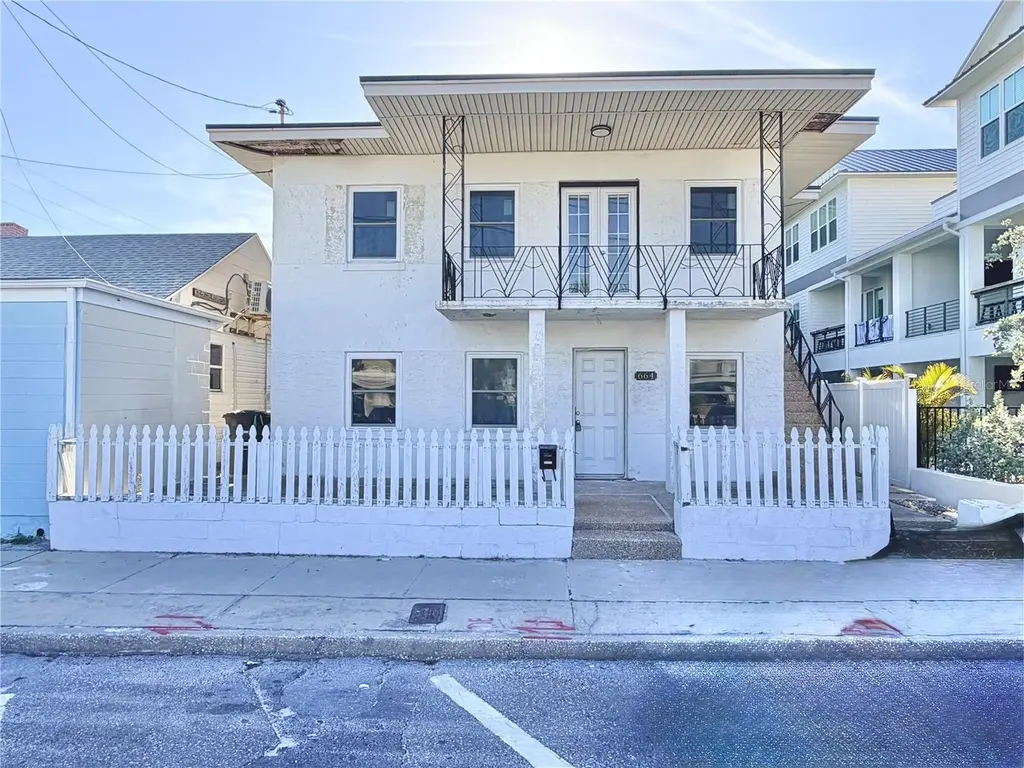
664 Mandalay Ave
Clearwater, FL 33767
$899,000C-
4 bd · 2.0 ba ·
1,632 sqft ·
Built 1946
· Townhouse
· Pending
· 3 DOM
Cashflow @ list (25.0% down · 7.5%)
Estimated rent
$7,750/mo
Mortgage (P&I)
−$4,714
Tax + insurance
−$1,528
HOA
−$0
Vac / Maint / Mgmt
−$1,627
Net cashflow
$-120/mo
Annual
$-1,436/yr
Cap rate
6.13%
Cash-on-cash
-0.57%
DSCR
0.97
1% rule
0.86%
Cash to close
$251,720
Investor read
- This is a 4-bed/2.0-bath townhouse listed at $899k.
- At list price, monthly cash flow is $-120 ($-1k/yr) — negative.
- To cash-flow at today's rent, offer at most $878k (2.4% below list).
- To meet the 1% rule (rent ≥ 1% of price), the offer needs to be $775k (13.8% below list).
- Only 3 days on market — expect competitive offers; lowballing is unlikely to land.
- Recommended offer: $775k (13.8% below list) — sets the bar for 1% rule.
- In year one you build about $23k of equity ($6k loan paydown + $17k appreciation (1.9% local appreciation)).
- Location reads 82/100 on livability (#60 in FL, #988 nationally) — a professional / high-income tenant draw. Strengths: commute A+, housing A+, health & safety A+; Watch: employment C-.
- Pinellas (suburban): math 51% / reading 51% proficiency, ranked #31 of 73 in FL (top 42%) — acceptable for families but not a draw, mixed tenant base, ~2y average lease.
- Zoned schools: Plumb Elementary School (math 56% / reading 54%, grade C, #872 of 2,144 statewide, top 42%, 622 students, 56% FRL); Clearwater High School (math 30% / reading 36%, grade F, #406 of 667 statewide, top 61%, 1,664 students, 59% FRL).
- Watch-outs: built in 1946 — expect roof / HVAC / electrical / plumbing capex.
- Market conditions: Rents rising (+2.8%/yr); 424 active listings in the ZIP; 18 comparable units currently listed for rent nearby; rentals at typical pace (median 18d on market — plan ~3-4 weeks tenant-placement turnaround); high-income renter base; 2,676 units permitted in Pinellas County in 2024 (1,422 in 5+ unit buildings).
- Pinellas County population projected at +14% by 2050 — modest demand growth; plan on rents tracking national, not racing it.
- 4 sale attempts since 5y ago with the ask held roughly flat each time — persistent listings suggest the price (not the market) is what's stuck; bring a comps-based counter.
- Current owner paid $770k; 17% above their basis — modest negotiation headroom, anchor on the comps not their cost.
- By year 3, paydown + projected appreciation supports a ~$59k cash-out refi (75% LTV) — recoverable capital for the next deal without selling this one.
- Cap rate 6.1% vs local median 2.9% in Clearwater — top-decile yield for the area; either an underpriced asset or a hidden risk that comps aren't pricing in. Stress-test before assuming the spread holds.
- At $7,750/mo this rent would consume 79% of the median local household income ($117k/yr) (locally 295% of renters already pay >50% of income on rent) — very limited rent-growth headroom before tenants either downsize or default.
Questions for listing agent
- What do current leases actually rent for vs. the listed asking? Can we see a recent rent roll and the last 12 months of T-12 income?
- Built in 1946 — when were the roof, HVAC, electrical panel, plumbing, and water heater last replaced?
- Is there a deadline driving the sale (1031 exchange, divorce, estate, relocation)? That informs how much negotiation room exists.
- What's the average days-on-market for RENTAL listings here right now (not sales)? A rising rental-DOM trend means longer vacancies and softer asking-rent achievability than the comps imply.
- What's the recent tenant-quality profile in this submarket — average credit score on applications, eviction rate, late-payment / NSF rate, and stable-employment percentage? A property-management company in the area should have these aggregated.
- How much new for-sale + rental construction is in the pipeline within 1–3 miles? Heavy new supply typically softens prices + rents 12–24 months out; constrained supply supports both.
CashFlowRE · CFR-YFTXGJ18HCTWMS
· Data 6 days ago
cashflowre.app · 2026-05-29