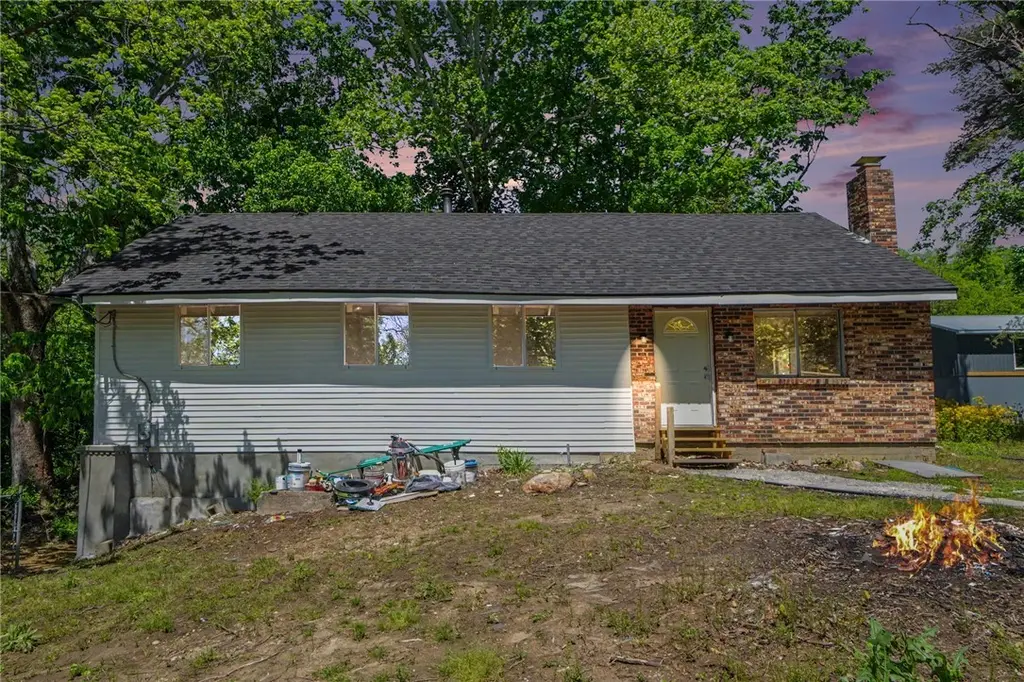
8547 Davis Rd
Loveland Park, OH 45039
$299,900D+
3 bd · 1.0 ba ·
1,075 sqft ·
Built 1955
· SingleFamily
· Pending
· 26 DOM
Cashflow @ list (25.0% down · 7.5%)
Estimated rent
$2,247/mo
Mortgage (P&I)
−$1,573
Tax + insurance
−$773
HOA
−$0
Vac / Maint / Mgmt
−$472
Net cashflow
$-570/mo
Annual
$-6,839/yr
Cap rate
5.85%
Cash-on-cash
-1.56%
DSCR
0.93
1% rule
0.75%
Cash to close
$83,972
Investor read
- This is a 3-bed/1.0-bath single-family listed at $300k.
- At list price, monthly cash flow is $-570 ($-7k/yr) — negative.
- To cash-flow at today's rent, offer at most $199k (33.6% below list).
- To meet the 1% rule (rent ≥ 1% of price), the offer needs to be $225k (25.1% below list).
- It's been on market 26 days — a 2% lower offer ($295k) is reasonable based on typical stale-listing flexibility.
- Recommended offer: $199k (33.6% below list) — sets the bar for cash-flow.
- In year one you build about $32k of equity ($2k loan paydown + $30k appreciation (10.0% local appreciation)).
- Location reads 74/100 on livability (#285 in OH, #4,658 nationally) — a middle-class / working-renter tenant base. Strengths: crime A+, employment A+, cost of living A+; Watch: schools D, amenities F, commute F.
- Kings Local (suburban): math 76% / reading 78% proficiency, ranked #61 of 656 in OH (top 9%) — strong family-tenant draw, lease renewals of 3-5y typical; only 16% free/reduced lunch — higher-income household profile.
- Watch-outs: flood insurance adds $460/mo; built in 1955 — expect roof / HVAC / electrical / plumbing capex.
- Market conditions: Rents rising fast (+7.4%/yr); 130 active listings in the ZIP; 5 comparable units currently listed for rent nearby; rentals at typical pace (median 25d on market — plan ~3-4 weeks tenant-placement turnaround); solid renter incomes; 1,224 units permitted in Warren County in 2024 (474 in 5+ unit buildings).
- Warren County population projected at +16% by 2050 — long-run rental-demand tailwind backs the buy-and-hold thesis.
- 8 sale attempts since 8y ago with the ask held roughly flat each time — persistent listings suggest the price (not the market) is what's stuck; bring a comps-based counter.
- Current owner paid $73k; list at $300k implies a 311% gain — meaningful room to come down on a strong offer.
- By year 2, paydown + projected appreciation supports a ~$52k cash-out refi (75% LTV) — recoverable capital for the next deal without selling this one.
- Climate carrying-cost: in FEMA flood zone AE (mandatory federal flood insurance) — expect insurance premiums to compound above CPI over the hold.
Questions for listing agent
- What do current leases actually rent for vs. the listed asking? Can we see a recent rent roll and the last 12 months of T-12 income?
- Built in 1955 — when were the roof, HVAC, electrical panel, plumbing, and water heater last replaced?
- What's the actual annual flood-insurance premium (NFIP or private), and is the property in a SFHA with mandatory coverage?
- Is there a deadline driving the sale (1031 exchange, divorce, estate, relocation)? That informs how much negotiation room exists.
- Schools are D-rated, which usually means shorter tenancies and higher turnover. Who's the typical renter profile here, and what's been the actual vacancy rate?
- The area grade is low — what's the realistic commute time and amenity access for the typical tenant pool here? Any planned neighborhood developments (good or bad) we should know about?
- What's the average days-on-market for RENTAL listings here right now (not sales)? A rising rental-DOM trend means longer vacancies and softer asking-rent achievability than the comps imply.
- What's the recent tenant-quality profile in this submarket — average credit score on applications, eviction rate, late-payment / NSF rate, and stable-employment percentage? A property-management company in the area should have these aggregated.
CashFlowRE · CFR-YGXBCCCK8NM8HH
· Data 3 days ago
cashflowre.app · 2026-05-29