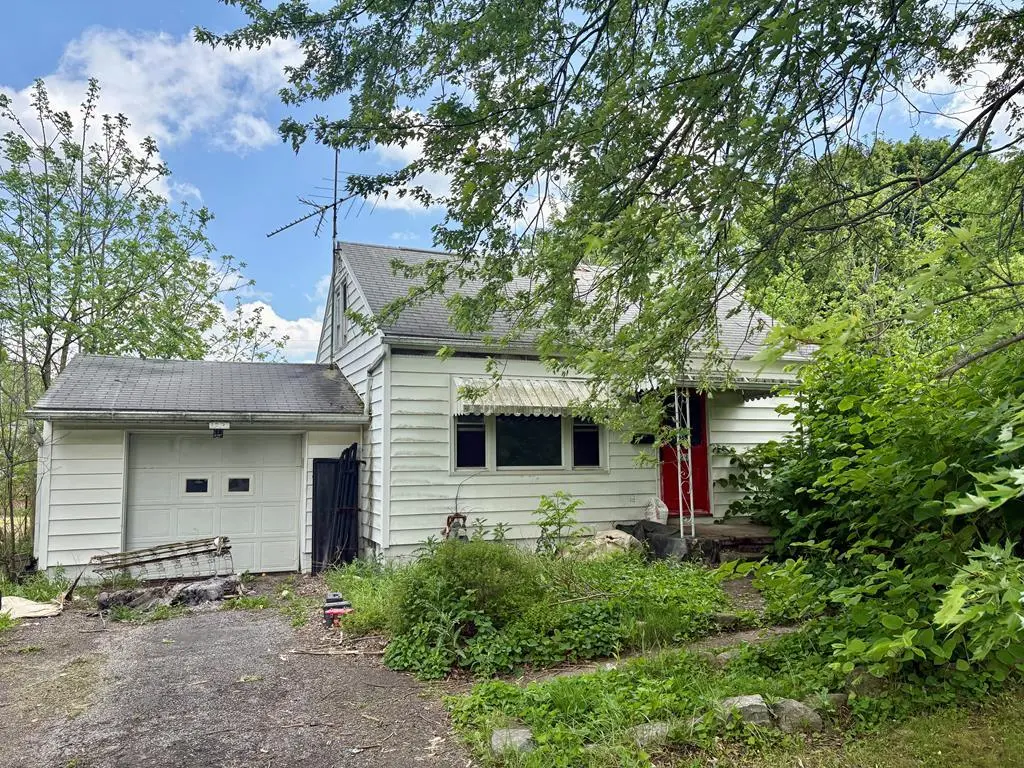
1231 Franklin Ave
Ashland, OH 44805
$99,000C
3 bd · 1.0 ba ·
1,075 sqft ·
Built 1953
· SingleFamily
· Pending
· 14 DOM
Cashflow @ list (25.0% down · 7.5%)
Estimated rent
$1,014/mo
Mortgage (P&I)
−$519
Tax + insurance
−$149
HOA
−$0
Vac / Maint / Mgmt
−$213
Net cashflow
$133/mo
Annual
$1,595/yr
Cap rate
7.90%
Cash-on-cash
5.75%
DSCR
1.26
1% rule
1.02%
Cash to close
$27,720
Investor read
- This is a 3-bed/1.0-bath single-family listed at $99k.
- At list price, monthly cash flow is $133 ($2k/yr) — positive.
- The deal already cash-flows at list — no discount required.
- Meets the 1% rule at list price ($1k rent vs $99k).
- Only 14 days on market — expect competitive offers; lowballing is unlikely to land.
- Local home prices are declining (-3.0%/yr); year-one equity from $684 of loan paydown is wiped out by about $3k of value loss. Plan a longer hold.
- Location reads 72/100 on livability (#373 in OH) — a middle-class / working-renter tenant base. Strengths: cost of living A+, housing A+, crime B+; Watch: employment C-, amenities D-, commute F.
- Ashland City (town): math 70% / reading 69% proficiency, ranked #165 of 656 in OH (top 25%) — acceptable for families but not a draw, mixed tenant base, ~2y average lease.
- Watch-outs: built in 1953 — expect roof / HVAC / electrical / plumbing capex.
- Market conditions: Rents rising fast (+7.1%/yr); 122 active listings in the ZIP; 4 comparable units currently listed for rent nearby; rentals lingering (median 44d on market — plan ~5-8 weeks vacancy on turnover, expect pricing pressure); 100% of comp listings sitting > 30 days — soft ceiling on asking rent; 61 units permitted in Ashland County in 2024 (0 in 5+ unit buildings).
- Ashland County population projected at -13% by 2050 — secular population decline; favor cash flow + early exit over multi-decade hold.
- Current owner paid $86k; 15% above their basis — modest negotiation headroom, anchor on the comps not their cost.
- At projected returns (-3.0% appreciation + 7.1% rent growth), your $28k cash investment doubles in ~10 years — after that, you're playing with house money.
- Cap rate 7.9% vs local median 3.8% in Ashland — top-decile yield for the area; either an underpriced asset or a hidden risk that comps aren't pricing in. Stress-test before assuming the spread holds.
- This rent is only 18% of the median local income ($68k/yr) — well below the 30% rent-burden line; pricing power to push rent on renewal without tenant pushback.
Questions for listing agent
- Built in 1953 — when were the roof, HVAC, electrical panel, plumbing, and water heater last replaced?
- Is there a deadline driving the sale (1031 exchange, divorce, estate, relocation)? That informs how much negotiation room exists.
- Schools are B-rated — typically a magnet for longer-tenancy family renters. What's the average tenant stay here, and is there a school-zone premium baked into asking?
- What's the average days-on-market for RENTAL listings here right now (not sales)? A rising rental-DOM trend means longer vacancies and softer asking-rent achievability than the comps imply.
- What's the recent tenant-quality profile in this submarket — average credit score on applications, eviction rate, late-payment / NSF rate, and stable-employment percentage? A property-management company in the area should have these aggregated.
- How much new for-sale + rental construction is in the pipeline within 1–3 miles? Heavy new supply typically softens prices + rents 12–24 months out; constrained supply supports both.
CashFlowRE · CFR-YH8AAS8BFS4ZJ4
· Data 1 week ago
cashflowre.app · 2026-05-29