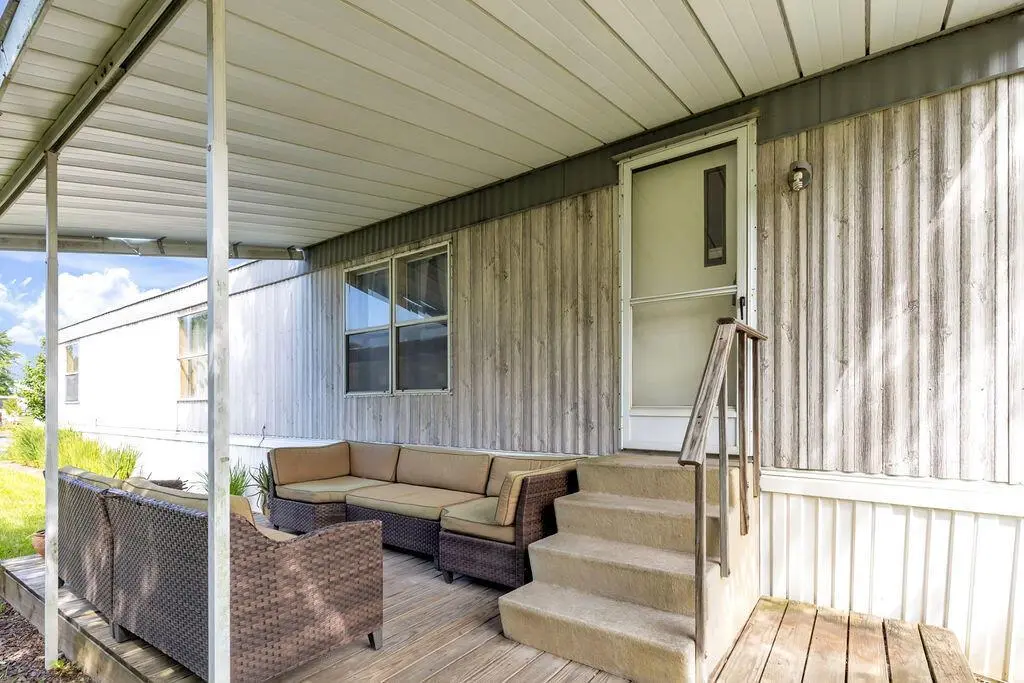
11050 Fancher Rd #169
Columbus, OH 43082
$29,900C
2 bd · 1.0 ba ·
980 sqft ·
Built 1997
· Manufactured
· Active
· 315 DOM
Cashflow @ list (25.0% down · 7.5%)
Estimated rent
$1,668/mo
Mortgage (P&I)
−$157
Tax + insurance
−$50
HOA
−$695
Vac / Maint / Mgmt
−$350
Net cashflow
$416/mo
Annual
$4,997/yr
Cap rate
23.01%
Cash-on-cash
59.69%
DSCR
3.66
1% rule
5.58%
Cash to close
$8,372
Investor read
- This is a 2-bed/1.0-bath manufactured listed at $30k.
- At list price, monthly cash flow is $416 ($5k/yr) — positive.
- The deal already cash-flows at list — no discount required.
- Meets the 1% rule at list price ($2k rent vs $30k).
- It's been on market 315 days — a 12% lower offer ($26k) is reasonable based on typical stale-listing flexibility.
- Recommended offer: $26k (12.0% below list) — sets the bar for market timing.
- Local home prices are declining (-3.0%/yr); year-one equity from $207 of loan paydown is wiped out by about $897 of value loss. Plan a longer hold.
- Location reads 81/100 on livability (#97 in OH, #1,491 nationally) — a professional / high-income tenant draw. Strengths: commute A+, cost of living A+, housing A+; Watch: employment C-, crime F.
- Big Walnut Local (rural): math 68% / reading 75% proficiency, ranked #103 of 656 in OH (top 16%) — strong family-tenant draw, lease renewals of 3-5y typical; only 15% free/reduced lunch — higher-income household profile.
- Watch-outs: HOA is 42% of rent.
- Market conditions: Rents rising (+1.7%/yr); 125 active listings in the ZIP; high-income renter base; 2,233 units permitted in Delaware County in 2024 (304 in 5+ unit buildings).
- Delaware County population projected at +37% by 2050 — long-run rental-demand tailwind backs the buy-and-hold thesis.
- 2 sale attempts since 14y ago; this cycle's ask has dropped $15k (33%) from the opening price — seller is motivated, your offer sets the floor, not the list.
- Current owner paid $9k; list at $30k implies a 232% gain — meaningful room to come down on a strong offer.
- At projected returns (-3.0% appreciation + 1.7% rent growth), your $8k cash investment doubles in ~2 years — after that, you're playing with house money.
- Cap rate 23.0% vs local median 3.8% in Columbus — top-decile yield for the area; either an underpriced asset or a hidden risk that comps aren't pricing in. Stress-test before assuming the spread holds.
- This rent is only 14% of the median local income ($148k/yr) — well below the 30% rent-burden line; pricing power to push rent on renewal without tenant pushback.
Questions for listing agent
- It's been on market 315 days. Have you received any prior offers? Is the seller open to a 12% concession, seller financing, or rate buy-down credit?
- What does the HOA fee cover, when was the last increase, and are there any pending special assessments or reserve-fund shortfalls?
- Why hasn't it sold? Are there any deal-killer items the seller is aware of (foundation, flood, title, zoning, code violations)?
- Is there a deadline driving the sale (1031 exchange, divorce, estate, relocation)? That informs how much negotiation room exists.
- Crime grade is F in this area — have there been break-ins, vandalism, or insurance claims at this property in the last 3 years? What carrier currently insures it and at what premium?
- What's the average days-on-market for RENTAL listings here right now (not sales)? A rising rental-DOM trend means longer vacancies and softer asking-rent achievability than the comps imply.
- What's the recent tenant-quality profile in this submarket — average credit score on applications, eviction rate, late-payment / NSF rate, and stable-employment percentage? A property-management company in the area should have these aggregated.
- How much new for-sale + rental construction is in the pipeline within 1–3 miles? Heavy new supply typically softens prices + rents 12–24 months out; constrained supply supports both.
CashFlowRE · CFR-YHH4TGF0WXQ2T2
· Data 2 days ago
cashflowre.app · 2026-05-29