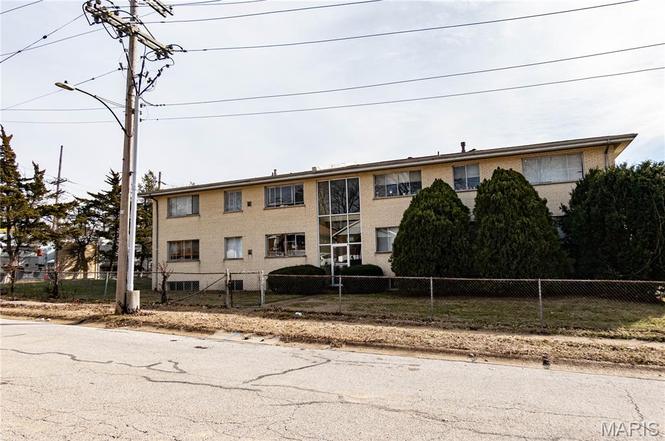
8331 Duryea Ave
Jennings, MO 63136
$1,300,000B+
3 bd · 2.0 ba ·
26,883 sqft ·
Built 1963
· MultiFamily
· Pending
· 39 DOM
Cashflow @ list (25.0% down · 7.5%)
Estimated rent
$23,362/mo
Mortgage (P&I)
−$6,817
Tax + insurance
−$1,489
HOA
−$0
Vac / Maint / Mgmt
−$4,906
Net cashflow
$10,150/mo
Annual
$121,795/yr
Cap rate
15.66%
Cash-on-cash
33.46%
DSCR
2.49
1% rule
1.80%
Cash to close
$364,000
Investor read
- This is a 21 × 1-bed/?-bath units multifamily listed at $1.30M.
- At list price, monthly cash flow is $10k ($122k/yr) — positive. Per door: $483/mo.
- The deal already cash-flows at list — no discount required.
- Meets the 1% rule at list price ($23k rent vs $1.30M).
- It's been on market 39 days — a 3% lower offer ($1.26M) is reasonable based on typical stale-listing flexibility.
- Recommended offer: $1.26M (3.0% below list) — sets the bar for market timing.
- In year one you build about $58k of equity ($9k loan paydown + $49k appreciation (3.8% local appreciation)).
- Location reads 67/100 on livability (#208 in MO) — a middle-class / working-renter tenant base. Strengths: cost of living A+, commute A-, housing A-; Watch: crime F, amenities F, employment F.
- Jennings (suburban): math 8% / reading 20% proficiency, ranked #315 of 324 in MO (top 97%) — low school quality limits family demand, transient renter base, plan for 1-2y turnover; 86% free/reduced lunch — lower-income household profile, screen leases tightly.
- Zoned schools: Fairview Primary (math 34% / reading 34%, grade F, #676 of 1,115 statewide, top 66%, 267 students, 100% FRL); Jennings High (math 8% / reading 17%, grade F, #497 of 521 statewide, top 96%, 691 students, 100% FRL).
- Market conditions: Rents rising fast (+5.0%/yr); 372 active listings in the ZIP; lower-income renter base — watch delinquency; 920 units permitted in St. Louis County in 2024 (250 in 5+ unit buildings).
- At projected returns (3.8% appreciation + 5.0% rent growth), your $364k cash investment doubles in ~2 years — after that, you're playing with house money.
- By year 2, paydown + projected appreciation supports a ~$94k cash-out refi (75% LTV) — recoverable capital for the next deal without selling this one.
- Climate carrying-cost: extreme-heat days projected 7→21/yr by 2055 (HVAC capex compounding) — expect insurance premiums to compound above CPI over the hold.
- Cap rate 15.7% vs local median 12.2% in Jennings — meaningfully above typical; check what's discounted (condition, days-on-market, listing class) to confirm the premium yield is real.
- At $23,362/mo this rent would consume 681% of the median local household income ($41k/yr) (locally 3085% of renters already pay >50% of income on rent) — very limited rent-growth headroom before tenants either downsize or default.
Questions for listing agent
- It's been on market 39 days. Have you received any prior offers? Is the seller open to a 3% concession, seller financing, or rate buy-down credit?
- Can we see the unit-by-unit rent roll, current vacancy, and any below-market leases? What's the average tenancy length?
- What capital expenditures (roof, boiler, parking lot, exteriors) have been made in the last 5 years, and what's planned in the next 2?
- Built in 1963 — when were the roof, HVAC, electrical panel, plumbing, and water heater last replaced?
- Is there a deadline driving the sale (1031 exchange, divorce, estate, relocation)? That informs how much negotiation room exists.
- Schools are D-rated, which usually means shorter tenancies and higher turnover. Who's the typical renter profile here, and what's been the actual vacancy rate?
- Crime grade is F in this area — have there been break-ins, vandalism, or insurance claims at this property in the last 3 years? What carrier currently insures it and at what premium?
- What's the average days-on-market for RENTAL listings here right now (not sales)? A rising rental-DOM trend means longer vacancies and softer asking-rent achievability than the comps imply.
CashFlowRE · CFR-YHRCCMD08ZMC5D
· Data 1 week ago
cashflowre.app · 2026-05-29