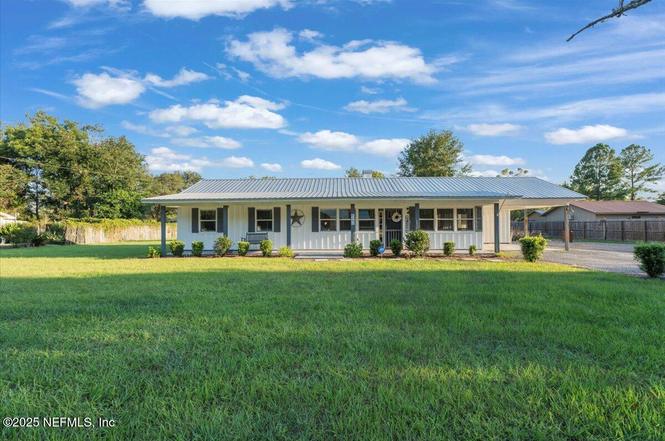
6582 Hamilton Crews Rd
Glen St. Mary, FL 32040
$310,000F
3 bd · 2.0 ba ·
1,328 sqft ·
Built 1993
· SingleFamily
· Active
· 268 DOM
Cashflow @ list (25.0% down · 7.5%)
Estimated rent
$2,408/mo
Mortgage (P&I)
−$1,626
Tax + insurance
−$185
HOA
−$0
Vac / Maint / Mgmt
−$506
Net cashflow
$91/mo
Annual
$1,096/yr
Cap rate
6.65%
Cash-on-cash
1.26%
DSCR
1.06
1% rule
0.78%
Cash to close
$86,800
Investor read
- This is a 3-bed/2.0-bath single-family listed at $310k.
- At list price, monthly cash flow is $91 ($1k/yr) — positive.
- The deal already cash-flows at list — no discount required.
- To meet the 1% rule (rent ≥ 1% of price), the offer needs to be $241k (22.3% below list).
- It's been on market 268 days — a 12% lower offer ($273k) is reasonable based on typical stale-listing flexibility.
- Recommended offer: $241k (22.3% below list) — sets the bar for 1% rule.
- Local home prices are declining (-3.0%/yr); year-one equity from $2k of loan paydown is wiped out by about $9k of value loss. Plan a longer hold.
- Location reads: area grade F — affects rentability + tenant quality, not the cash-flow math above.
- Baker (town): math 53% / reading 49% proficiency, ranked #28 of 73 in FL (top 38%) — acceptable for families but not a draw, mixed tenant base, ~2y average lease.
- Zoned schools: Prek/Kindergarten Center (592 students, 58% FRL); Baker County Middle School (math 47% / reading 42%, grade D, #320 of 571 statewide, top 57%, 1,102 students, 52% FRL); Baker County Senior High School (math 41% / reading 48%, grade F, #237 of 667 statewide, top 36%, 1,425 students, 40% FRL) — zoned schools at 50% FRL track the district average.
- Market conditions: 64 active listings in the ZIP; 99 units permitted in Baker County in 2024 (0 in 5+ unit buildings).
- Baker County population projected to shrink 9% by 2050 — rents likely to lag national; underwrite the cash flow, not the appreciation.
- 7 sale attempts since 8y ago with the ask held roughly flat each time — persistent listings suggest the price (not the market) is what's stuck; bring a comps-based counter.
- Climate carrying-cost: severe wind risk, 99% chance of damaging wind over 30y; major wildfire risk; extreme-heat days projected 7→20/yr by 2055 (HVAC capex compounding) — expect insurance premiums to compound above CPI over the hold.
- Cap rate 6.6% vs local median 3.5% in Glen St. Mary — top-decile yield for the area; either an underpriced asset or a hidden risk that comps aren't pricing in. Stress-test before assuming the spread holds.
Questions for listing agent
- It's been on market 268 days. Have you received any prior offers? Is the seller open to a 22% concession, seller financing, or rate buy-down credit?
- Why hasn't it sold? Are there any deal-killer items the seller is aware of (foundation, flood, title, zoning, code violations)?
- Is there a deadline driving the sale (1031 exchange, divorce, estate, relocation)? That informs how much negotiation room exists.
- The area grade is low — what's the realistic commute time and amenity access for the typical tenant pool here? Any planned neighborhood developments (good or bad) we should know about?
- What's the average days-on-market for RENTAL listings here right now (not sales)? A rising rental-DOM trend means longer vacancies and softer asking-rent achievability than the comps imply.
- What's the recent tenant-quality profile in this submarket — average credit score on applications, eviction rate, late-payment / NSF rate, and stable-employment percentage? A property-management company in the area should have these aggregated.
- How much new for-sale + rental construction is in the pipeline within 1–3 miles? Heavy new supply typically softens prices + rents 12–24 months out; constrained supply supports both.
CashFlowRE · CFR-YPHAGC6WFCWM92
· Data 4 h ago
cashflowre.app · 2026-05-29