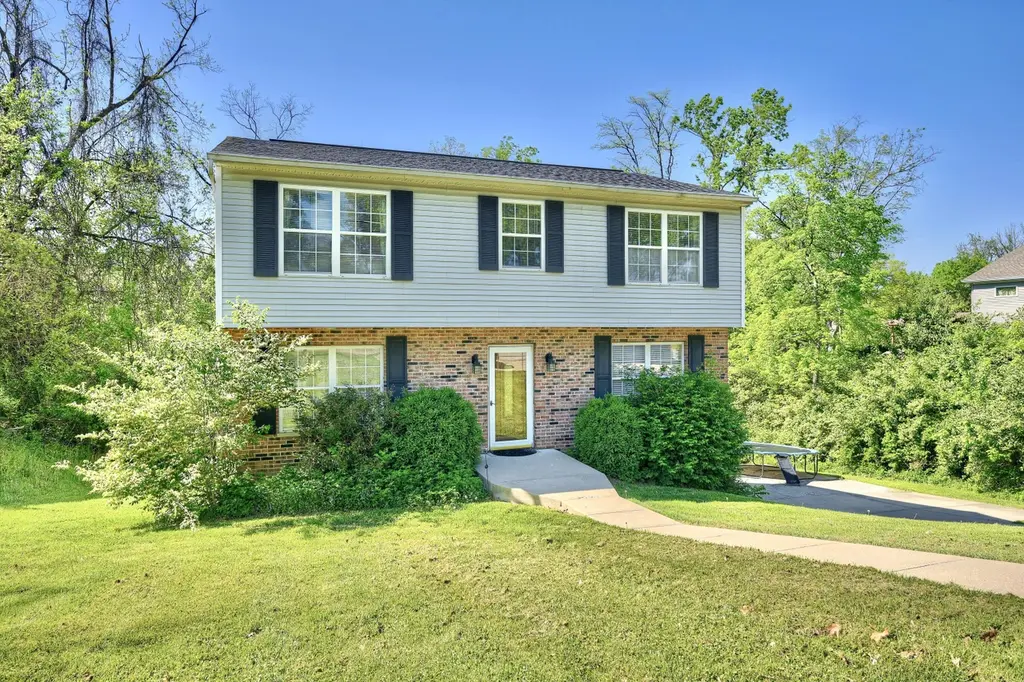
736 Oakland Dr
Taylor Mill, KY 41015
$320,000D-
4 bd · 2.5 ba ·
1,520 sqft ·
Built 1997
· SingleFamily
· Pending
· 52 DOM
Cashflow @ list (25.0% down · 7.5%)
Estimated rent
$2,495/mo
Mortgage (P&I)
−$1,678
Tax + insurance
−$365
HOA
−$0
Vac / Maint / Mgmt
−$524
Net cashflow
$-72/mo
Annual
$-863/yr
Cap rate
6.02%
Cash-on-cash
-0.96%
DSCR
0.96
1% rule
0.78%
Cash to close
$89,600
Investor read
- This is a 4-bed/2.5-bath single-family listed at $320k.
- At list price, monthly cash flow is $-72 ($-863/yr) — negative.
- To cash-flow at today's rent, offer at most $307k (4.0% below list).
- To meet the 1% rule (rent ≥ 1% of price), the offer needs to be $250k (22.0% below list).
- It's been on market 52 days — a 3% lower offer ($310k) is reasonable based on typical stale-listing flexibility.
- Recommended offer: $250k (22.0% below list) — sets the bar for 1% rule.
- Local home prices are declining (-3.0%/yr); year-one equity from $2k of loan paydown is wiped out by about $10k of value loss. Plan a longer hold.
- Location reads 82/100 on livability (#63 in KY, #1,246 nationally) — a professional / high-income tenant draw. Strengths: crime A+, commute A+, employment A+; Watch: amenities F.
- Kenton County (suburban): math 42% / reading 48% proficiency, ranked #14 of 165 in KY (top 8%) — families likely to look elsewhere, expect single-tenant / working-renter base with shorter leases.
- Zoned schools: Taylor Mill Elementary School (math 52% / reading 47%, grade D, #100 of 676 statewide, top 16%, 492 students, 48% FRL); Woodland Middle School (math 38% / reading 50%, grade D, #40 of 217 statewide, top 19%, 616 students, 48% FRL); Scott High School (math 33% / reading 33%, grade F, #94 of 254 statewide, top 37%, 1,071 students, 42% FRL).
- Market conditions: 161 active listings in the ZIP; 1 comparable units currently listed for rent nearby; 699 units permitted in Kenton County in 2024 (287 in 5+ unit buildings).
- Kenton County population projected at +5% by 2050 — modest demand growth; plan on rents tracking national, not racing it.
- 2 sale attempts since 3y ago with the ask held roughly flat each time — persistent listings suggest the price (not the market) is what's stuck; bring a comps-based counter.
Questions for listing agent
- What do current leases actually rent for vs. the listed asking? Can we see a recent rent roll and the last 12 months of T-12 income?
- It's been on market 52 days. Have you received any prior offers? Is the seller open to a 22% concession, seller financing, or rate buy-down credit?
- Is there a deadline driving the sale (1031 exchange, divorce, estate, relocation)? That informs how much negotiation room exists.
- The area grade is low — what's the realistic commute time and amenity access for the typical tenant pool here? Any planned neighborhood developments (good or bad) we should know about?
- What's the average days-on-market for RENTAL listings here right now (not sales)? A rising rental-DOM trend means longer vacancies and softer asking-rent achievability than the comps imply.
- What's the recent tenant-quality profile in this submarket — average credit score on applications, eviction rate, late-payment / NSF rate, and stable-employment percentage? A property-management company in the area should have these aggregated.
- How much new for-sale + rental construction is in the pipeline within 1–3 miles? Heavy new supply typically softens prices + rents 12–24 months out; constrained supply supports both.
CashFlowRE · CFR-YQWPXZ7QV15FNV
· Data 5 days ago
cashflowre.app · 2026-05-29