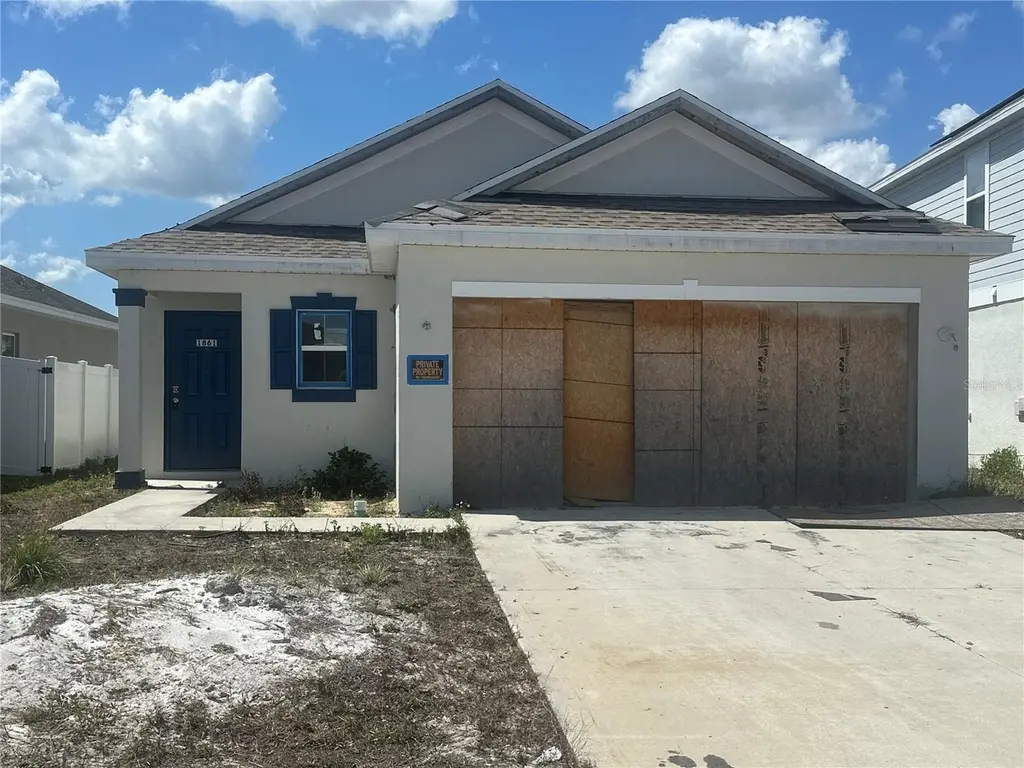
1861 Heart Lake Dr
Groveland, FL 34736
$175,000B-
3 bd · 2.0 ba ·
1,851 sqft ·
Built 2022
· SingleFamily
· Pending
· 6 DOM
Cashflow @ list (25.0% down · 7.5%)
Estimated rent
$2,722/mo
Mortgage (P&I)
−$918
Tax + insurance
−$268
HOA
−$96
Vac / Maint / Mgmt
−$572
Net cashflow
$869/mo
Annual
$10,425/yr
Cap rate
12.25%
Cash-on-cash
21.28%
DSCR
1.95
1% rule
1.56%
Cash to close
$49,000
Investor read
- This is a 3-bed/2.0-bath single-family listed at $175k. Condition is rated poor.
- At list price, monthly cash flow is $869 ($10k/yr) — positive.
- The deal already cash-flows at list — no discount required.
- Meets the 1% rule at list price ($3k rent vs $175k).
- Only 6 days on market — expect competitive offers; lowballing is unlikely to land.
- Local home prices are declining (-3.0%/yr); year-one equity from $1k of loan paydown is wiped out by about $5k of value loss. Plan a longer hold.
- Location reads 70/100 on livability (#416 in FL) — a middle-class / working-renter tenant base. Strengths: housing A+, health & safety A-, crime B+; Watch: schools C-, amenities F, commute F.
- Lake (suburban): math 49% / reading 50% proficiency, ranked #37 of 73 in FL (top 51%) — families likely to look elsewhere, expect single-tenant / working-renter base with shorter leases.
- Market conditions: Rents rising (+1.7%/yr); 585 active listings in the ZIP; 4 comparable units currently listed for rent nearby; rentals at typical pace (median 25d on market — plan ~3-4 weeks tenant-placement turnaround); solid renter incomes; 4,799 units permitted in Lake County in 2024 (814 in 5+ unit buildings).
- Lake County population projected at +37% by 2050 — long-run rental-demand tailwind backs the buy-and-hold thesis.
- 2 sale attempts since 5y ago with the ask held roughly flat each time — persistent listings suggest the price (not the market) is what's stuck; bring a comps-based counter.
- At projected returns (-3.0% appreciation + 1.7% rent growth), your $49k cash investment doubles in ~7 years — after that, you're playing with house money.
- Climate carrying-cost: severe wind risk, 99% chance of damaging wind over 30y; major wildfire risk; extreme-heat days projected 7→24/yr by 2055 (HVAC capex compounding) — expect insurance premiums to compound above CPI over the hold.
- Cap rate 12.2% vs local median 4.0% in Groveland — top-decile yield for the area; either an underpriced asset or a hidden risk that comps aren't pricing in. Stress-test before assuming the spread holds.
- This rent runs 36% of the median local income ($91k/yr) — at the standard rent-burdened threshold; future hikes will face affordability resistance.
Questions for listing agent
- Have any recent inspections been done? Can we get a copy of the seller's disclosures and any deferred-maintenance estimates?
- What does the HOA fee cover, when was the last increase, and are there any pending special assessments or reserve-fund shortfalls?
- Is there a deadline driving the sale (1031 exchange, divorce, estate, relocation)? That informs how much negotiation room exists.
- What's the average days-on-market for RENTAL listings here right now (not sales)? A rising rental-DOM trend means longer vacancies and softer asking-rent achievability than the comps imply.
- What's the recent tenant-quality profile in this submarket — average credit score on applications, eviction rate, late-payment / NSF rate, and stable-employment percentage? A property-management company in the area should have these aggregated.
- How much new for-sale + rental construction is in the pipeline within 1–3 miles? Heavy new supply typically softens prices + rents 12–24 months out; constrained supply supports both.
Repairs flagged (vision-AI assessment)
- Major: roof — Exposed framing, no visible roof
- Major: exterior siding — Exposed framing, no siding
- Major: flooring — Exposed framing, no flooring
- Major: interior walls — Exposed framing, no drywall
- Major: HVAC — Exposed framing, no HVAC
- Major: systems — Exposed framing, no systems
CashFlowRE · CFR-YTCY2B891RB4Q0
· Data 3 weeks ago
cashflowre.app · 2026-05-29