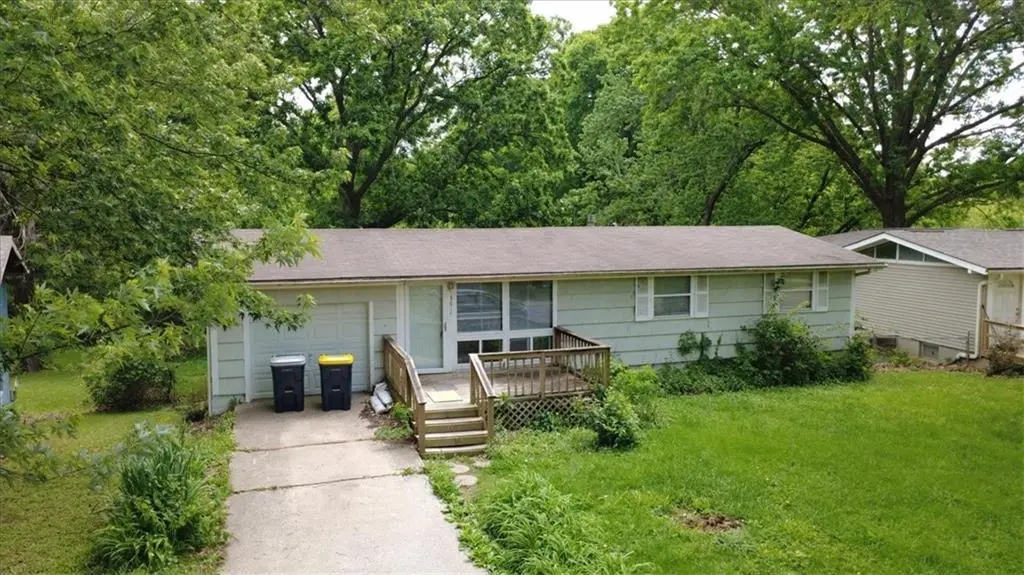
3617 NE Cypress Dr
Kansas City, MO 64117
$160,000C-
3 bd · 1.0 ba ·
1,025 sqft ·
Built 1963
· SingleFamily
· Pending
· 5 DOM
Cashflow @ list (25.0% down · 7.5%)
Estimated rent
$1,406/mo
Mortgage (P&I)
−$839
Tax + insurance
−$237
HOA
−$0
Vac / Maint / Mgmt
−$295
Net cashflow
$35/mo
Annual
$425/yr
Cap rate
6.56%
Cash-on-cash
0.95%
DSCR
1.04
1% rule
0.88%
Cash to close
$44,800
Investor read
- This is a 3-bed/1.0-bath single-family listed at $160k.
- At list price, monthly cash flow is $35 ($425/yr) — positive.
- The deal already cash-flows at list — no discount required.
- To meet the 1% rule (rent ≥ 1% of price), the offer needs to be $141k (12.1% below list).
- Only 5 days on market — expect competitive offers; lowballing is unlikely to land.
- Recommended offer: $141k (12.1% below list) — sets the bar for 1% rule.
- Local home prices are declining (-3.0%/yr); year-one equity from $1k of loan paydown is wiped out by about $5k of value loss. Plan a longer hold.
- Location reads 78/100 on livability (#28 in MO, #2,671 nationally) — a middle-class / working-renter tenant base. Strengths: amenities A+, commute A+, cost of living A+; Watch: crime F.
- North Kansas City 74 (urban): math 38% / reading 49% proficiency, ranked #98 of 324 in MO (top 30%) — families likely to look elsewhere, expect single-tenant / working-renter base with shorter leases.
- Zoned schools: Chouteau Elementary (math 37% / reading 37%, grade F, #611 of 1,115 statewide, top 59%, 358 students, 72% FRL); Eastgate 6Th Grade Center (math 26% / reading 35%, grade F, #283 of 391 statewide, top 74%, 607 students, 65% FRL); North Kansas City High (math 14% / reading 37%, grade F, #433 of 521 statewide, top 83%, 1,640 students, 55% FRL) — zoned schools average 64% FRL vs 37% district-wide (27 pts higher); higher-poverty schools than district average — tighter screening recommended.
- Zoned-school proficiency averages 31% at this address vs 44% district-wide (-12 pts) — the specific schools serving this property underperform the North Kansas City 74 average; the district grade overstates school quality for this exact location.
- Market conditions: Rents flat; 50 active listings in the ZIP; 7 comparable units currently listed for rent nearby; rentals at typical pace (median 22d on market — plan ~3-4 weeks tenant-placement turnaround); 341 units permitted in Clay County in 2024 (40 in 5+ unit buildings).
- Clay County population projected at +24% by 2050 — long-run rental-demand tailwind backs the buy-and-hold thesis.
- 2 sale attempts since 28y ago with the ask held roughly flat each time — persistent listings suggest the price (not the market) is what's stuck; bring a comps-based counter.
- Cap rate 6.6% vs local median 3.9% in Kansas City — top-decile yield for the area; either an underpriced asset or a hidden risk that comps aren't pricing in. Stress-test before assuming the spread holds.
Questions for listing agent
- Built in 1963 — when were the roof, HVAC, electrical panel, plumbing, and water heater last replaced?
- Is there a deadline driving the sale (1031 exchange, divorce, estate, relocation)? That informs how much negotiation room exists.
- Crime grade is F in this area — have there been break-ins, vandalism, or insurance claims at this property in the last 3 years? What carrier currently insures it and at what premium?
- What's the average days-on-market for RENTAL listings here right now (not sales)? A rising rental-DOM trend means longer vacancies and softer asking-rent achievability than the comps imply.
- What's the recent tenant-quality profile in this submarket — average credit score on applications, eviction rate, late-payment / NSF rate, and stable-employment percentage? A property-management company in the area should have these aggregated.
- How much new for-sale + rental construction is in the pipeline within 1–3 miles? Heavy new supply typically softens prices + rents 12–24 months out; constrained supply supports both.
CashFlowRE · CFR-YWMJZGB565K37T
· Data 4 weeks ago
cashflowre.app · 2026-05-29