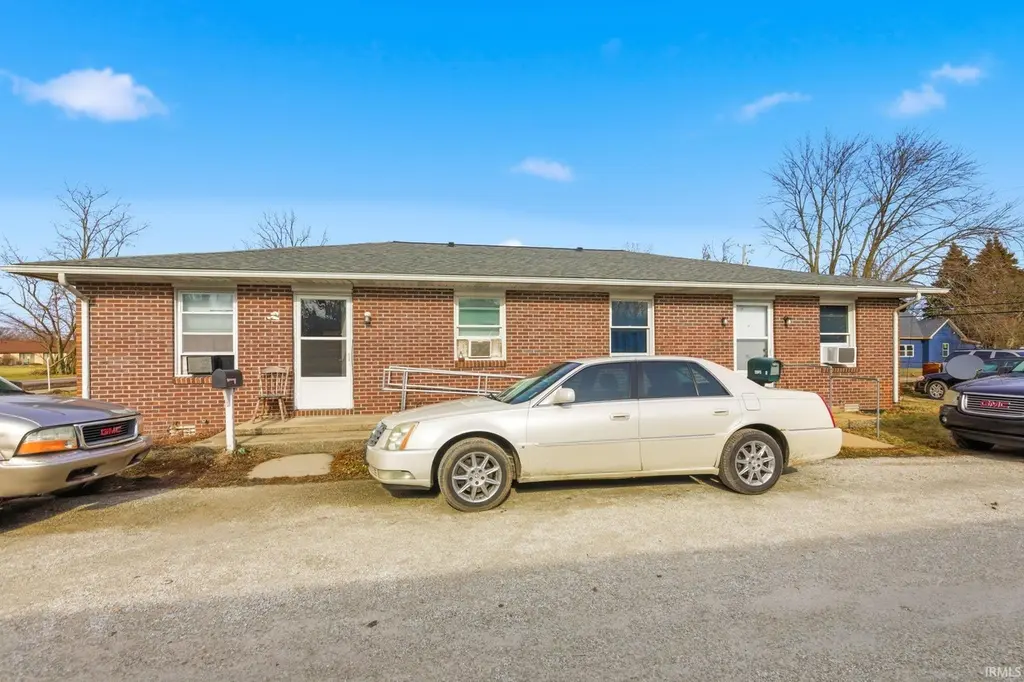
3625 S Landess St
Marion, IN 46953
$100,000B-
2 bd · 1.0 ba ·
780 sqft ·
Built 1979
· MultiFamily
· Pending
· 2 DOM
Cashflow @ list (25.0% down · 7.5%)
Estimated rent
$1,616/mo
Mortgage (P&I)
−$524
Tax + insurance
−$164
HOA
−$0
Vac / Maint / Mgmt
−$339
Net cashflow
$588/mo
Annual
$7,059/yr
Cap rate
13.35%
Cash-on-cash
25.21%
DSCR
2.12
1% rule
1.62%
Cash to close
$28,000
Investor read
- This is a 2 × 2-bed/1.0-bath units multifamily listed at $100k.
- At list price, monthly cash flow is $588 ($7k/yr) — positive. Per door: $294/mo.
- The deal already cash-flows at list — no discount required.
- Meets the 1% rule at list price ($2k rent vs $100k).
- Only 2 days on market — expect competitive offers; lowballing is unlikely to land.
- Local home prices are declining (-3.0%/yr); year-one equity from $691 of loan paydown is wiped out by about $3k of value loss. Plan a longer hold.
- Location reads 65/100 on livability (#337 in IN) — a middle-class / working-renter tenant base. Strengths: crime A+, cost of living A+, housing A+; Watch: amenities F, commute F, employment F.
- Marion Community Schools (town): math 18% / reading 24% proficiency, ranked #277 of 301 in IN (top 92%) — low school quality limits family demand, transient renter base, plan for 1-2y turnover; 67% free/reduced lunch — lower-income household profile, screen leases tightly.
- Zoned schools: Frances Slocum Elem School (math 12% / reading 12%, grade F, #893 of 994 statewide, top 91%, 472 students, 81% FRL); John L Mcculloch Junior High Sch (math 11% / reading 22%, grade F, #287 of 330 statewide, top 88%, 524 students, 74% FRL); Marion High School (math 12% / reading 47%, grade F, #308 of 369 statewide, top 84%, 1,050 students, 66% FRL).
- Market conditions: 112 active listings in the ZIP; 3 comparable units currently listed for rent nearby; rentals lingering (median 44d on market — plan ~5-8 weeks vacancy on turnover, expect pricing pressure); 100% of comp listings sitting > 30 days — soft ceiling on asking rent; 52 units permitted in Grant County in 2024 (8 in 5+ unit buildings).
- Grant County population projected at -18% by 2050 — secular population decline; favor cash flow + early exit over multi-decade hold.
- At projected returns (-3.0% appreciation + 3.0% rent growth), your $28k cash investment doubles in ~5 years — after that, you're playing with house money.
- Cap rate 13.4% vs local median 8.7% in Marion — top-decile yield for the area; either an underpriced asset or a hidden risk that comps aren't pricing in. Stress-test before assuming the spread holds.
- This rent runs 42% of the median local income ($46k/yr) — at the standard rent-burdened threshold; future hikes will face affordability resistance.
Questions for listing agent
- Can we see the unit-by-unit rent roll, current vacancy, and any below-market leases? What's the average tenancy length?
- What capital expenditures (roof, boiler, parking lot, exteriors) have been made in the last 5 years, and what's planned in the next 2?
- Built in 1979 — when were the roof, HVAC, electrical panel, plumbing, and water heater last replaced?
- Is there a deadline driving the sale (1031 exchange, divorce, estate, relocation)? That informs how much negotiation room exists.
- Schools are F-rated, which usually means shorter tenancies and higher turnover. Who's the typical renter profile here, and what's been the actual vacancy rate?
- What's the average days-on-market for RENTAL listings here right now (not sales)? A rising rental-DOM trend means longer vacancies and softer asking-rent achievability than the comps imply.
- What's the recent tenant-quality profile in this submarket — average credit score on applications, eviction rate, late-payment / NSF rate, and stable-employment percentage? A property-management company in the area should have these aggregated.
- How much new apartment / multifamily construction is in the pipeline within 1–3 miles? Heavy new supply (>2% of stock underway) typically softens rents 12–24 months out; light construction supports rent growth.
CashFlowRE · CFR-YYAMWN98GT52DN
· Data 3 weeks ago
cashflowre.app · 2026-05-29