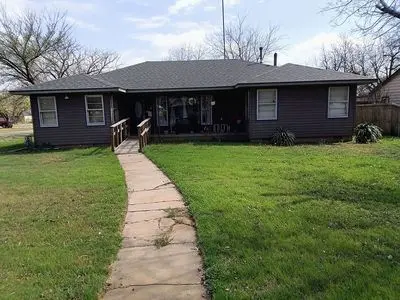
622 N 14th St
Frederick, OK 73542
$120,000B-
3 bd · 2.0 ba ·
1,876 sqft ·
Built 1950
· SingleFamily
· Active
· 5 DOM
Cashflow @ list (25.0% down · 7.5%)
Estimated rent
$1,249/mo
Mortgage (P&I)
−$629
Tax + insurance
−$88
HOA
−$0
Vac / Maint / Mgmt
−$262
Net cashflow
$269/mo
Annual
$3,226/yr
Cap rate
8.98%
Cash-on-cash
9.60%
DSCR
1.43
1% rule
1.04%
Cash to close
$33,600
Investor read
- This is a 3-bed/2.0-bath single-family listed at $120k.
- At list price, monthly cash flow is $269 ($3k/yr) — positive.
- The deal already cash-flows at list — no discount required.
- Meets the 1% rule at list price ($1k rent vs $120k).
- Only 5 days on market — expect competitive offers; lowballing is unlikely to land.
- Local home prices are declining (-3.0%/yr); year-one equity from $830 of loan paydown is wiped out by about $4k of value loss. Plan a longer hold.
- Location reads 61/100 on livability (#304 in OK) — a middle-class / working-renter tenant base. Strengths: cost of living A+, housing A+; Watch: crime D, amenities F, commute F.
- Frederick (town): math 41% / reading 28% proficiency, ranked #46 of 270 in OK (top 17%) — families likely to look elsewhere, expect single-tenant / working-renter base with shorter leases; 68% free/reduced lunch — lower-income household profile, screen leases tightly.
- Zoned schools: Frederick Es (math 57% / reading 27%, grade F, #84 of 845 statewide, top 11%, 386 students, 0% FRL); Frederick Ms (math 32% / reading 32%, grade F, #39 of 345 statewide, top 12%, 174 students, 0% FRL); Frederick Hs (math 15% / reading 24%, grade F, #274 of 447 statewide, top 66%, 250 students, 0% FRL) — zoned schools average 0% FRL vs 68% district-wide (68 pts lower); this property's tenant base skews higher-income than the district average.
- Watch-outs: built in 1950 — expect roof / HVAC / electrical / plumbing capex.
- Market conditions: 31 active listings in the ZIP.
- Tillman County population projected to shrink 8% by 2050 — rents likely to lag national; underwrite the cash flow, not the appreciation.
- 6 sale attempts since 9y ago with the ask held roughly flat each time — persistent listings suggest the price (not the market) is what's stuck; bring a comps-based counter.
- Current owner paid $89k; 35% above their basis — modest negotiation headroom, anchor on the comps not their cost.
- Climate carrying-cost: extreme-heat days projected 7→18/yr by 2055 (HVAC capex compounding) — expect insurance premiums to compound above CPI over the hold.
Questions for listing agent
- Built in 1950 — when were the roof, HVAC, electrical panel, plumbing, and water heater last replaced?
- Is there a deadline driving the sale (1031 exchange, divorce, estate, relocation)? That informs how much negotiation room exists.
- Schools are D-rated, which usually means shorter tenancies and higher turnover. Who's the typical renter profile here, and what's been the actual vacancy rate?
- Crime grade is D in this area — have there been break-ins, vandalism, or insurance claims at this property in the last 3 years? What carrier currently insures it and at what premium?
- What's the average days-on-market for RENTAL listings here right now (not sales)? A rising rental-DOM trend means longer vacancies and softer asking-rent achievability than the comps imply.
- What's the recent tenant-quality profile in this submarket — average credit score on applications, eviction rate, late-payment / NSF rate, and stable-employment percentage? A property-management company in the area should have these aggregated.
- How much new for-sale + rental construction is in the pipeline within 1–3 miles? Heavy new supply typically softens prices + rents 12–24 months out; constrained supply supports both.
CashFlowRE · CFR-YZAC5T70TB1DWZ
· Data 2 weeks ago
cashflowre.app · 2026-05-29