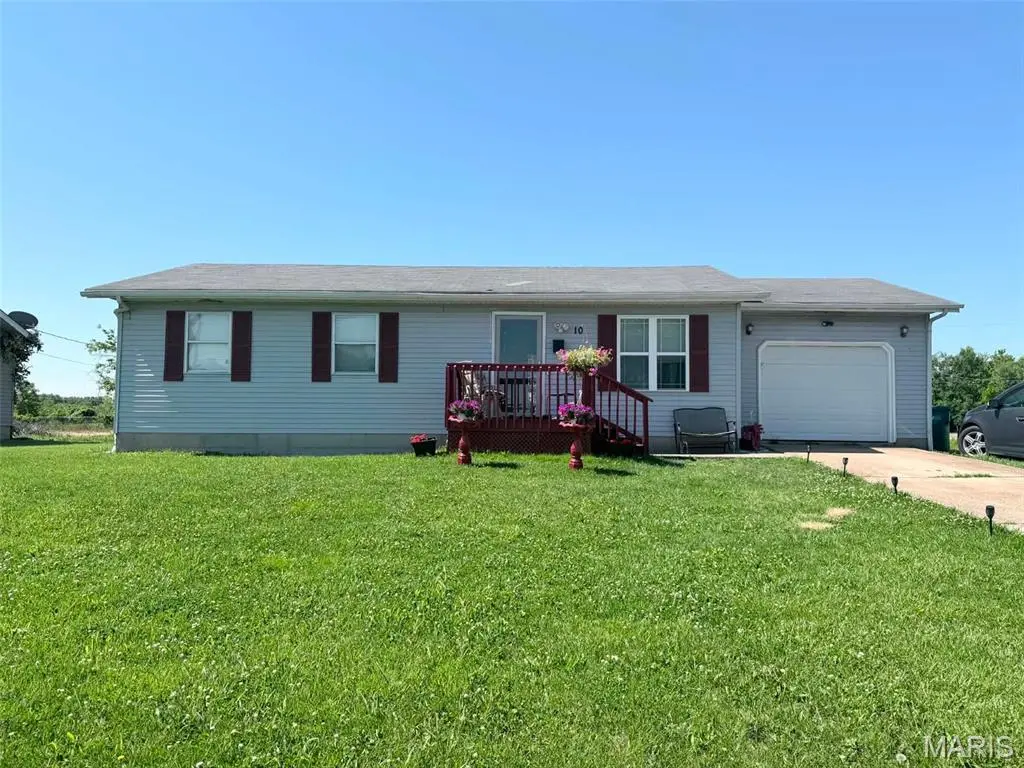
10 Ruby St
Cahokia Heights, IL 62206
$89,000C+
3 bd · 2.0 ba ·
1,040 sqft ·
Built 1991
· SingleFamily
· Pending
· 16 DOM
Cashflow @ list (25.0% down · 7.5%)
Estimated rent
$1,437/mo
Mortgage (P&I)
−$467
Tax + insurance
−$300
HOA
−$0
Vac / Maint / Mgmt
−$302
Net cashflow
$368/mo
Annual
$4,413/yr
Cap rate
13.30%
Cash-on-cash
25.03%
DSCR
2.11
1% rule
1.61%
Cash to close
$24,920
Investor read
- This is a 3-bed/2.0-bath single-family listed at $89k.
- At list price, monthly cash flow is $368 ($4k/yr) — positive.
- The deal already cash-flows at list — no discount required.
- Meets the 1% rule at list price ($1k rent vs $89k).
- It's been on market 16 days — a 2% lower offer ($88k) is reasonable based on typical stale-listing flexibility.
- Recommended offer: $88k (1.5% below list) — sets the bar for market timing.
- Local home prices are declining (-3.0%/yr); year-one equity from $615 of loan paydown is wiped out by about $3k of value loss. Plan a longer hold.
- Location reads: area grade C — affects rentability + tenant quality, not the cash-flow math above.
- Cahokia CUSD 187 (suburban): math 3% / reading 5% proficiency, ranked #864 of 919 in IL (top 94%) — low school quality limits family demand, transient renter base, plan for 1-2y turnover; 85% free/reduced lunch — lower-income household profile, screen leases tightly.
- Zoned schools: Cahokia High School (math 8% / reading 2%, grade F, #614 of 693 statewide, top 95%, 845 students, 0% FRL) — zoned schools average 0% FRL vs 85% district-wide (85 pts lower); this property's tenant base skews higher-income than the district average.
- Watch-outs: flood insurance adds $152/mo.
- Market conditions: 153 active listings in the ZIP; 29 comparable units currently listed for rent nearby; rentals at typical pace (median 24d on market — plan ~3-4 weeks tenant-placement turnaround); lower-income renter base — watch delinquency; 783 units permitted in St. Clair County in 2024 (378 in 5+ unit buildings).
- St. Clair County population projected at -23% by 2050 — secular population decline; favor cash flow + early exit over multi-decade hold.
- 6 sale attempts since 2y ago with the ask held roughly flat each time — persistent listings suggest the price (not the market) is what's stuck; bring a comps-based counter.
- Current owner paid $50k; list at $89k implies a 78% gain — meaningful room to come down on a strong offer.
- At projected returns (-3.0% appreciation + 3.0% rent growth), your $25k cash investment doubles in ~7 years — after that, you're playing with house money.
- Climate carrying-cost: in FEMA flood zone AH (mandatory federal flood insurance); extreme-heat days projected 7→21/yr by 2055 (HVAC capex compounding) — expect insurance premiums to compound above CPI over the hold.
- At $1,437/mo this rent would consume 51% of the median local household income ($34k/yr) (locally 729% of renters already pay >50% of income on rent) — very limited rent-growth headroom before tenants either downsize or default.
Questions for listing agent
- What's the actual annual flood-insurance premium (NFIP or private), and is the property in a SFHA with mandatory coverage?
- Is there a deadline driving the sale (1031 exchange, divorce, estate, relocation)? That informs how much negotiation room exists.
- What's the average days-on-market for RENTAL listings here right now (not sales)? A rising rental-DOM trend means longer vacancies and softer asking-rent achievability than the comps imply.
- What's the recent tenant-quality profile in this submarket — average credit score on applications, eviction rate, late-payment / NSF rate, and stable-employment percentage? A property-management company in the area should have these aggregated.
- How much new for-sale + rental construction is in the pipeline within 1–3 miles? Heavy new supply typically softens prices + rents 12–24 months out; constrained supply supports both.
CashFlowRE · CFR-Z1AJEKBPMVJ5X0
· Data 3 weeks ago
cashflowre.app · 2026-05-29