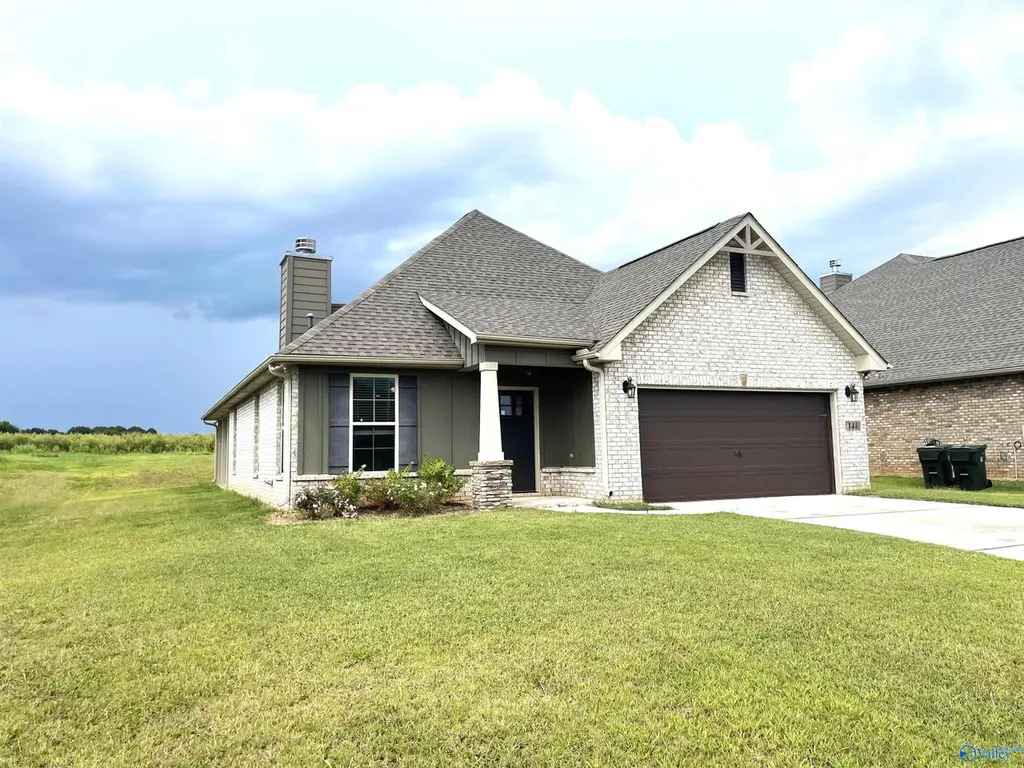
146 Elledge Farm Dr
Hazel Green, AL 35750
$289,000D+
4 bd · 1.0 ba ·
2,019 sqft ·
Built 2020
· SingleFamily
· Active
· 302 DOM
Cashflow @ list (25.0% down · 7.5%)
Estimated rent
$1,893/mo
Mortgage (P&I)
−$1,516
Tax + insurance
−$195
HOA
−$0
Vac / Maint / Mgmt
−$398
Net cashflow
$-215/mo
Annual
$-2,580/yr
Cap rate
5.40%
Cash-on-cash
-3.19%
DSCR
0.86
1% rule
0.65%
Cash to close
$80,920
Investor read
- This is a 4-bed/1.0-bath single-family listed at $289k.
- At list price, monthly cash flow is $-215 ($-3k/yr) — negative.
- To cash-flow at today's rent, offer at most $251k (13.1% below list).
- To meet the 1% rule (rent ≥ 1% of price), the offer needs to be $189k (34.5% below list).
- It's been on market 302 days — a 12% lower offer ($254k) is reasonable based on typical stale-listing flexibility.
- Recommended offer: $189k (34.5% below list) — sets the bar for 1% rule.
- In year one you build about $31k of equity ($2k loan paydown + $29k appreciation (10.0% local appreciation)).
- Location reads 69/100 on livability (#54 in AL) — a middle-class / working-renter tenant base. Strengths: cost of living A+, housing A+, crime A; Watch: schools C-, amenities F, commute F.
- Madison County (rural): math 27% / reading 56% proficiency, ranked #19 of 129 in AL (top 15%) — families likely to look elsewhere, expect single-tenant / working-renter base with shorter leases.
- Market conditions: 256 active listings in the ZIP; 12 comparable units currently listed for rent nearby; rentals lingering (median 44d on market — plan ~5-8 weeks vacancy on turnover, expect pricing pressure); 50% of comp listings sitting > 30 days — soft ceiling on asking rent; 4,709 units permitted in Madison County in 2024 (1,186 in 5+ unit buildings).
- Madison County population projected at +18% by 2050 — long-run rental-demand tailwind backs the buy-and-hold thesis.
- 6 sale attempts since 6y ago with the ask held roughly flat each time — persistent listings suggest the price (not the market) is what's stuck; bring a comps-based counter.
- By year 2, paydown + projected appreciation supports a ~$50k cash-out refi (75% LTV) — recoverable capital for the next deal without selling this one.
- Cap rate 5.4% vs local median 3.9% in Hazel Green — top-decile yield for the area; either an underpriced asset or a hidden risk that comps aren't pricing in. Stress-test before assuming the spread holds.
- This rent runs 33% of the median local income ($68k/yr) — at the standard rent-burdened threshold; future hikes will face affordability resistance.
Questions for listing agent
- What do current leases actually rent for vs. the listed asking? Can we see a recent rent roll and the last 12 months of T-12 income?
- It's been on market 302 days. Have you received any prior offers? Is the seller open to a 35% concession, seller financing, or rate buy-down credit?
- Why hasn't it sold? Are there any deal-killer items the seller is aware of (foundation, flood, title, zoning, code violations)?
- Is there a deadline driving the sale (1031 exchange, divorce, estate, relocation)? That informs how much negotiation room exists.
- The area grade is low — what's the realistic commute time and amenity access for the typical tenant pool here? Any planned neighborhood developments (good or bad) we should know about?
- What's the average days-on-market for RENTAL listings here right now (not sales)? A rising rental-DOM trend means longer vacancies and softer asking-rent achievability than the comps imply.
- What's the recent tenant-quality profile in this submarket — average credit score on applications, eviction rate, late-payment / NSF rate, and stable-employment percentage? A property-management company in the area should have these aggregated.
- How much new for-sale + rental construction is in the pipeline within 1–3 miles? Heavy new supply typically softens prices + rents 12–24 months out; constrained supply supports both.
CashFlowRE · CFR-Z2NJYT4MBMBJED
· Data 2 days ago
cashflowre.app · 2026-05-29