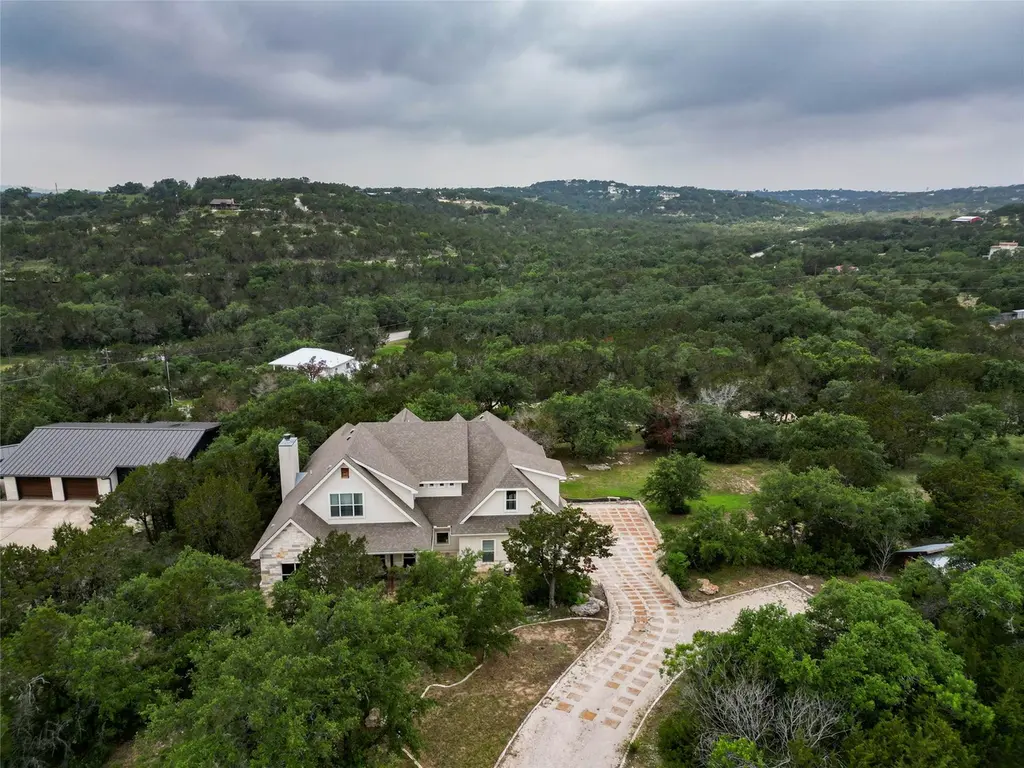
20501 Bee Hive Ln
Lakeway, TX 78669
$759,000F
3 bd · 3.0 ba ·
3,451 sqft ·
Built 2015
· SingleFamily
· Active
· 297 DOM
Cashflow @ list (25.0% down · 7.5%)
Estimated rent
$3,050/mo
Mortgage (P&I)
−$3,980
Tax + insurance
−$1,221
HOA
−$0
Vac / Maint / Mgmt
−$640
Net cashflow
$-2,792/mo
Annual
$-33,502/yr
Cap rate
1.88%
Cash-on-cash
-15.76%
DSCR
0.30
1% rule
0.40%
Cash to close
$212,520
Investor read
- This is a 3-bed/3.0-bath single-family listed at $759k.
- At list price, monthly cash flow is $-3k ($-34k/yr) — negative.
- To cash-flow at today's rent, offer at most $266k (65.0% below list).
- To meet the 1% rule (rent ≥ 1% of price), the offer needs to be $305k (59.8% below list).
- It's been on market 297 days — a 12% lower offer ($668k) is reasonable based on typical stale-listing flexibility.
- Recommended offer: $266k (65.0% below list) — sets the bar for cash-flow.
- Local home prices are declining (-3.0%/yr); year-one equity from $5k of loan paydown is wiped out by about $23k of value loss. Plan a longer hold.
- Location reads 71/100 on livability (#330 in TX) — a middle-class / working-renter tenant base. Strengths: crime A+, employment A+, housing A+; Watch: amenities F, commute F, cost of living F.
- Lake Travis ISD (rural): math 57% / reading 61% proficiency, ranked #39 of 826 in TX (top 5%) — acceptable for families but not a draw, mixed tenant base, ~2y average lease; only 15% free/reduced lunch — higher-income household profile.
- Zoned schools: West Cypress Hills El (math 42% / reading 52%, grade D-, #1,006 of 4,322 statewide, top 25%, 599 students, 11% FRL); Lake Travis Middle (math 60% / reading 57%, grade B, #185 of 1,662 statewide, top 12%, 878 students, 0% FRL); Lake Travis H S (math 54% / reading 75%, grade B-, #199 of 1,632 statewide, top 14%, 3,701 students, 0% FRL).
- Market conditions: Rents rising (+3.4%/yr); 653 active listings in the ZIP; 2 comparable units currently listed for rent nearby; high-income renter base; 17,121 units permitted in Travis County in 2024 (11,963 in 5+ unit buildings).
- Travis County population projected at +60% by 2050 — long-run rental-demand tailwind backs the buy-and-hold thesis.
- 4 sale attempts since 9y ago; this cycle's ask has dropped $141k (16%) from the opening price — seller is motivated, your offer sets the floor, not the list.
- Climate carrying-cost: major wind risk, 67% chance of damaging wind over 30y; moderate wildfire risk; extreme-heat days projected 7→23/yr by 2055 (HVAC capex compounding) — expect insurance premiums to compound above CPI over the hold.
Questions for listing agent
- What do current leases actually rent for vs. the listed asking? Can we see a recent rent roll and the last 12 months of T-12 income?
- It's been on market 297 days. Have you received any prior offers? Is the seller open to a 65% concession, seller financing, or rate buy-down credit?
- Why hasn't it sold? Are there any deal-killer items the seller is aware of (foundation, flood, title, zoning, code violations)?
- Is there a deadline driving the sale (1031 exchange, divorce, estate, relocation)? That informs how much negotiation room exists.
- Schools are B-rated — typically a magnet for longer-tenancy family renters. What's the average tenant stay here, and is there a school-zone premium baked into asking?
- The area grade is low — what's the realistic commute time and amenity access for the typical tenant pool here? Any planned neighborhood developments (good or bad) we should know about?
- What's the average days-on-market for RENTAL listings here right now (not sales)? A rising rental-DOM trend means longer vacancies and softer asking-rent achievability than the comps imply.
- What's the recent tenant-quality profile in this submarket — average credit score on applications, eviction rate, late-payment / NSF rate, and stable-employment percentage? A property-management company in the area should have these aggregated.
CashFlowRE · CFR-Z2P5RQ020JYZSJ
· Data 1 day ago
cashflowre.app · 2026-05-29