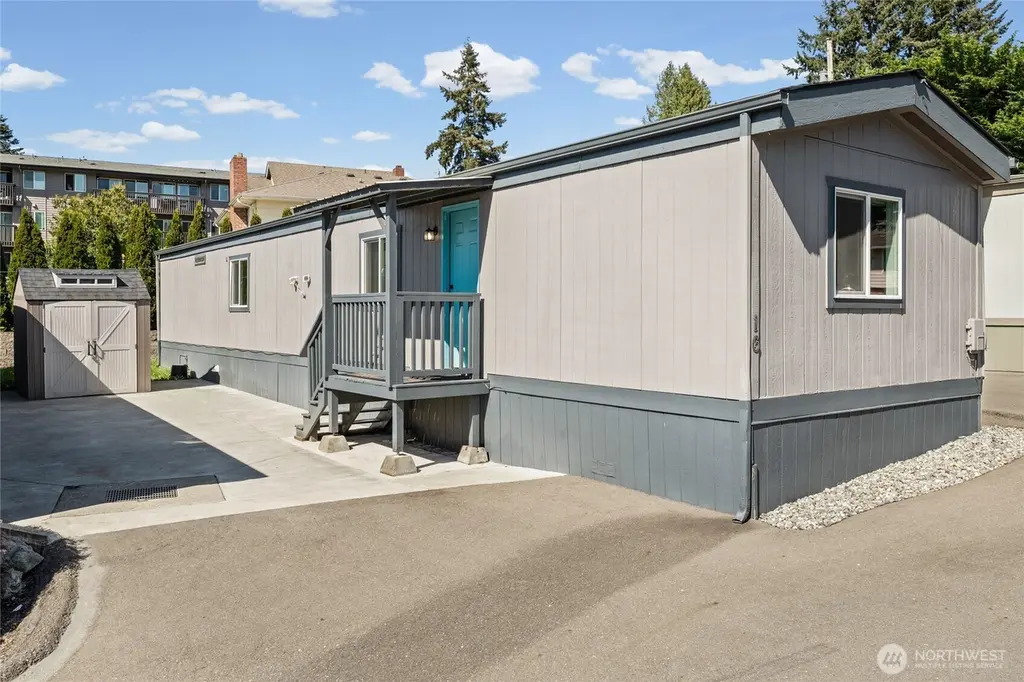
314 Ave J #16
Snohomish, WA 98290
$139,000A-
3 bd · 2.0 ba ·
924 sqft ·
Built 1986
· Manufactured
· Pending
· 20 DOM
Cashflow @ list (25.0% down · 7.5%)
Estimated rent
$2,289/mo
Mortgage (P&I)
−$729
Tax + insurance
−$86
HOA
−$0
Vac / Maint / Mgmt
−$481
Net cashflow
$993/mo
Annual
$11,920/yr
Cap rate
14.87%
Cash-on-cash
30.63%
DSCR
2.36
1% rule
1.65%
Cash to close
$38,920
Investor read
- This is a 3-bed/2.0-bath manufactured listed at $139k.
- At list price, monthly cash flow is $993 ($12k/yr) — positive.
- The deal already cash-flows at list — no discount required.
- Meets the 1% rule at list price ($2k rent vs $139k).
- It's been on market 20 days — a 2% lower offer ($137k) is reasonable based on typical stale-listing flexibility.
- Recommended offer: $137k (1.5% below list) — sets the bar for market timing.
- Local home prices are declining (-3.0%/yr); year-one equity from $961 of loan paydown is wiped out by about $4k of value loss. Plan a longer hold.
- Location reads 78/100 on livability (#120 in WA, #2,426 nationally) — a middle-class / working-renter tenant base. Strengths: health & safety A+, housing A, schools A-; Watch: amenities F, cost of living F.
- Snohomish School District (suburban): math 58% / reading 69% proficiency, ranked #25 of 291 in WA (top 9%) — acceptable for families but not a draw, mixed tenant base, ~2y average lease; only 18% free/reduced lunch — higher-income household profile.
- Market conditions: Rents rising fast (+8.8%/yr); 236 active listings in the ZIP; 12 comparable units currently listed for rent nearby; rentals lingering (median 44d on market — plan ~5-8 weeks vacancy on turnover, expect pricing pressure); 50% of comp listings sitting > 30 days — soft ceiling on asking rent; high-income renter base; 3,982 units permitted in Snohomish County in 2024 (1,492 in 5+ unit buildings).
- Snohomish County population projected at +30% by 2050 — long-run rental-demand tailwind backs the buy-and-hold thesis.
- 2 sale attempts since 5y ago with the ask held roughly flat each time — persistent listings suggest the price (not the market) is what's stuck; bring a comps-based counter.
- At projected returns (-3.0% appreciation + 8.0% rent growth), your $39k cash investment doubles in ~4 years — after that, you're playing with house money.
- Cap rate 14.9% vs local median 2.3% in Snohomish — top-decile yield for the area; either an underpriced asset or a hidden risk that comps aren't pricing in. Stress-test before assuming the spread holds.
Questions for listing agent
- Is there a deadline driving the sale (1031 exchange, divorce, estate, relocation)? That informs how much negotiation room exists.
- Schools are A-rated — typically a magnet for longer-tenancy family renters. What's the average tenant stay here, and is there a school-zone premium baked into asking?
- What's the average days-on-market for RENTAL listings here right now (not sales)? A rising rental-DOM trend means longer vacancies and softer asking-rent achievability than the comps imply.
- What's the recent tenant-quality profile in this submarket — average credit score on applications, eviction rate, late-payment / NSF rate, and stable-employment percentage? A property-management company in the area should have these aggregated.
- How much new for-sale + rental construction is in the pipeline within 1–3 miles? Heavy new supply typically softens prices + rents 12–24 months out; constrained supply supports both.
CashFlowRE · CFR-ZB70HF6X52JSX8
· Data 6 days ago
cashflowre.app · 2026-05-29