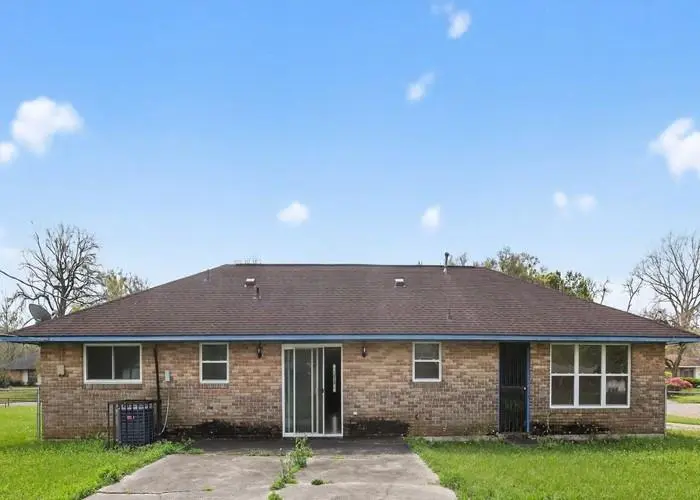
6127 Glen Oaks Dr
Baton Rouge, LA 70811
$98,600B
3 bd · 2.0 ba ·
1,508 sqft ·
Built 1979
· SingleFamily
· Pending
· 33 DOM
Cashflow @ list (25.0% down · 7.5%)
Estimated rent
$1,358/mo
Mortgage (P&I)
−$517
Tax + insurance
−$583
HOA
−$0
Vac / Maint / Mgmt
−$285
Net cashflow
$-27/mo
Annual
$-327/yr
Cap rate
11.15%
Cash-on-cash
17.36%
DSCR
1.77
1% rule
1.38%
Cash to close
$27,608
Investor read
- This is a 3-bed/2.0-bath single-family listed at $99k.
- At list price, monthly cash flow is $-27 ($-327/yr) — negative.
- To cash-flow at today's rent, offer at most $94k (4.9% below list).
- Meets the 1% rule at list price ($1k rent vs $99k).
- It's been on market 33 days — a 3% lower offer ($96k) is reasonable based on typical stale-listing flexibility.
- Recommended offer: $94k (4.9% below list) — sets the bar for cash-flow.
- Local home prices are declining (-3.0%/yr); year-one equity from $682 of loan paydown is wiped out by about $3k of value loss. Plan a longer hold.
- Location reads 74/100 on livability (#24 in LA, #4,535 nationally) — a middle-class / working-renter tenant base. Strengths: commute A+, cost of living A+, health & safety A+; Watch: amenities D, crime F, employment D-.
- East Baton Rouge Parish (urban): math 22% / reading 34% proficiency, ranked #47 of 98 in LA (top 48%) — low school quality limits family demand, transient renter base, plan for 1-2y turnover; 77% free/reduced lunch — lower-income household profile, screen leases tightly.
- Zoned schools: Merrydale Elementary School (math 8% / reading 12%, grade F, #597 of 646 statewide, top 95%, 274 students, 95% FRL); Glen Oaks Senior High School (math 3% / reading 7%, grade F, #260 of 265 statewide, top 100%, 679 students, 90% FRL) — zoned schools average 93% FRL vs 77% district-wide (15 pts higher); higher-poverty schools than district average — tighter screening recommended.
- Zoned-school proficiency averages 7% at this address vs 28% district-wide (-21 pts) — the specific schools serving this property underperform the East Baton Rouge Parish average; the district grade overstates school quality for this exact location.
- Watch-outs: flood insurance adds $427/mo.
- Market conditions: 123 active listings in the ZIP; 10 comparable units currently listed for rent nearby; rentals at typical pace (median 25d on market — plan ~3-4 weeks tenant-placement turnaround); 2,252 units permitted in East Baton Rouge Parish in 2024 (440 in 5+ unit buildings).
- East Baton Rouge County population projected at +4% by 2050 — modest demand growth; plan on rents tracking national, not racing it.
- 3 sale attempts; this cycle's ask has dropped $5k (5%) from the opening price — seller is motivated, your offer sets the floor, not the list.
- Current owner paid $83k; 19% above their basis — modest negotiation headroom, anchor on the comps not their cost.
- Climate carrying-cost: in FEMA flood zone AE (mandatory federal flood insurance); severe wind risk, 99% chance of damaging wind over 30y; extreme-heat days projected 7→20/yr by 2055 (HVAC capex compounding) — expect insurance premiums to compound above CPI over the hold.
- Cap rate 11.2% vs local median 4.2% in Baton Rouge — top-decile yield for the area; either an underpriced asset or a hidden risk that comps aren't pricing in. Stress-test before assuming the spread holds.
Questions for listing agent
- What do current leases actually rent for vs. the listed asking? Can we see a recent rent roll and the last 12 months of T-12 income?
- It's been on market 33 days. Have you received any prior offers? Is the seller open to a 5% concession, seller financing, or rate buy-down credit?
- Built in 1979 — when were the roof, HVAC, electrical panel, plumbing, and water heater last replaced?
- What's the actual annual flood-insurance premium (NFIP or private), and is the property in a SFHA with mandatory coverage?
- Is there a deadline driving the sale (1031 exchange, divorce, estate, relocation)? That informs how much negotiation room exists.
- Crime grade is F in this area — have there been break-ins, vandalism, or insurance claims at this property in the last 3 years? What carrier currently insures it and at what premium?
- What's the average days-on-market for RENTAL listings here right now (not sales)? A rising rental-DOM trend means longer vacancies and softer asking-rent achievability than the comps imply.
- What's the recent tenant-quality profile in this submarket — average credit score on applications, eviction rate, late-payment / NSF rate, and stable-employment percentage? A property-management company in the area should have these aggregated.
CashFlowRE · CFR-ZBMCKKBM7S21VF
· Data 4 weeks ago
cashflowre.app · 2026-05-29