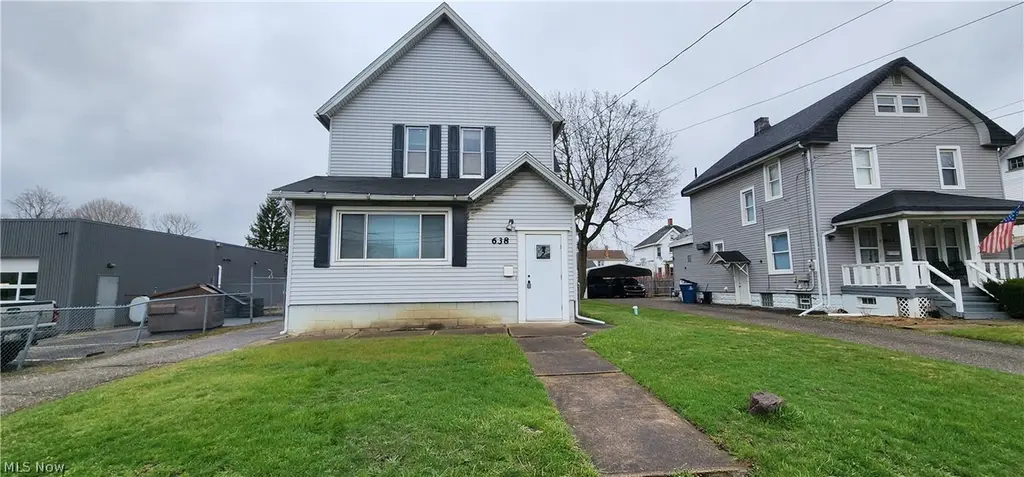
638 Robbins Ave
Niles, OH 44446
$149,900B-
5 bd · 2.0 ba ·
2,308 sqft ·
Built 1904
· MultiFamily
· Pending
· 18 DOM
Cashflow @ list (25.0% down · 7.5%)
Estimated rent
$2,112/mo
Mortgage (P&I)
−$786
Tax + insurance
−$148
HOA
−$0
Vac / Maint / Mgmt
−$444
Net cashflow
$734/mo
Annual
$8,808/yr
Cap rate
12.17%
Cash-on-cash
20.98%
DSCR
1.93
1% rule
1.41%
Cash to close
$41,972
Investor read
- This is a 1×3bd/1.0ba + 1×2bd/1.0ba units multifamily listed at $150k.
- At list price, monthly cash flow is $734 ($9k/yr) — positive. Per door: $367/mo.
- The deal already cash-flows at list — no discount required.
- Meets the 1% rule at list price ($2k rent vs $150k).
- It's been on market 18 days — a 2% lower offer ($148k) is reasonable based on typical stale-listing flexibility.
- Recommended offer: $148k (1.5% below list) — sets the bar for market timing.
- Local home prices are declining (-3.0%/yr); year-one equity from $1k of loan paydown is wiped out by about $4k of value loss. Plan a longer hold.
- Location reads 67/100 on livability (#628 in OH) — a middle-class / working-renter tenant base. Strengths: cost of living A+, housing A+; Watch: crime D+, employment D, amenities F.
- Niles City (suburban): math 37% / reading 52% proficiency, ranked #507 of 656 in OH (top 77%) — families likely to look elsewhere, expect single-tenant / working-renter base with shorter leases.
- Watch-outs: built in 1904 — expect roof / HVAC / electrical / plumbing capex.
- Market conditions: 65 active listings in the ZIP; 129 units permitted in Trumbull County in 2024 (0 in 5+ unit buildings).
- Trumbull County population projected at -22% by 2050 — secular population decline; favor cash flow + early exit over multi-decade hold.
- At projected returns (-3.0% appreciation + 3.0% rent growth), your $42k cash investment doubles in ~6 years — after that, you're playing with house money.
- Cap rate 12.2% vs local median 5.8% in Niles — top-decile yield for the area; either an underpriced asset or a hidden risk that comps aren't pricing in. Stress-test before assuming the spread holds.
- At $2,112/mo this rent would consume 50% of the median local household income ($50k/yr) (locally 820% of renters already pay >50% of income on rent) — very limited rent-growth headroom before tenants either downsize or default.
Questions for listing agent
- Can we see the unit-by-unit rent roll, current vacancy, and any below-market leases? What's the average tenancy length?
- What capital expenditures (roof, boiler, parking lot, exteriors) have been made in the last 5 years, and what's planned in the next 2?
- Built in 1904 — when were the roof, HVAC, electrical panel, plumbing, and water heater last replaced?
- Is there a deadline driving the sale (1031 exchange, divorce, estate, relocation)? That informs how much negotiation room exists.
- Schools are B-rated — typically a magnet for longer-tenancy family renters. What's the average tenant stay here, and is there a school-zone premium baked into asking?
- Crime grade is D in this area — have there been break-ins, vandalism, or insurance claims at this property in the last 3 years? What carrier currently insures it and at what premium?
- What's the average days-on-market for RENTAL listings here right now (not sales)? A rising rental-DOM trend means longer vacancies and softer asking-rent achievability than the comps imply.
- What's the recent tenant-quality profile in this submarket — average credit score on applications, eviction rate, late-payment / NSF rate, and stable-employment percentage? A property-management company in the area should have these aggregated.
CashFlowRE · CFR-ZDMJ44FRE66JH0
· Data 3 weeks ago
cashflowre.app · 2026-05-29