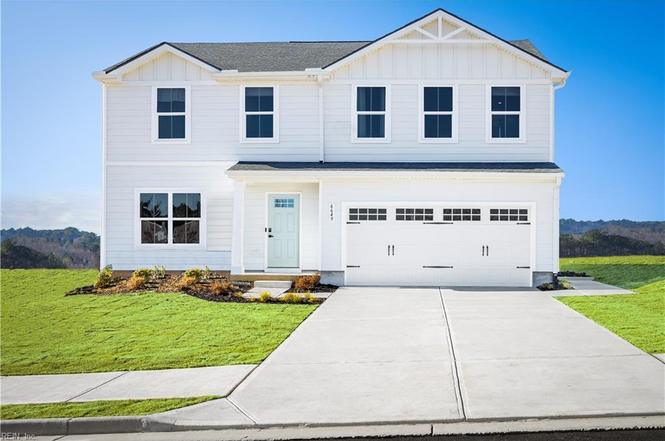
120 Jasmine Ct
South Mills, NC 27976
$409,990D-
4 bd · 2.5 ba ·
1,903 sqft ·
Built 2026
· SingleFamily
· Under Contract
· 20 DOM
Cashflow @ list (25.0% down · 7.5%)
Estimated rent
$3,300/mo
Mortgage (P&I)
−$2,150
Tax + insurance
−$683
HOA
−$65
Vac / Maint / Mgmt
−$693
Net cashflow
$-291/mo
Annual
$-3,496/yr
Cap rate
5.44%
Cash-on-cash
-3.05%
DSCR
0.86
1% rule
0.80%
Cash to close
$114,797
Investor read
- This is a 4-bed/2.5-bath single-family listed at $410k.
- At list price, monthly cash flow is $-291 ($-3k/yr) — negative.
- To cash-flow at today's rent, offer at most $368k (10.3% below list).
- To meet the 1% rule (rent ≥ 1% of price), the offer needs to be $330k (19.5% below list).
- It's been on market 20 days — a 2% lower offer ($404k) is reasonable based on typical stale-listing flexibility.
- Recommended offer: $330k (19.5% below list) — sets the bar for 1% rule.
- In year one you build about $1k of equity ($3k loan paydown + $-2k appreciation (-0.4% local appreciation)).
- Location reads 57/100 on livability (#612 in NC) — a working-class tenant base; expect higher turnover. Strengths: cost of living A+, crime A, housing A; Watch: amenities F, commute F, employment F.
- Camden County Schools (rural): math 56% / reading 64% proficiency, ranked #29 of 178 in NC (top 16%) — acceptable for families but not a draw, mixed tenant base, ~2y average lease.
- Zoned schools: Grandy Primary (math 87% / reading 72%, grade A, #24 of 1,410 statewide, top 2%, 607 students, 32% FRL); Camden Intermediate (math 50% / reading 61%, grade B-, #76 of 475 statewide, top 16%, 440 students, 24% FRL); Camden County High (math 62% / reading 62%, grade B-, #184 of 535 statewide, top 37%, 464 students, 25% FRL) — zoned schools at 27% FRL track the district average.
- Market conditions: 86 active listings in the ZIP; 1 comparable units currently listed for rent nearby; 105 units permitted in Camden County in 2024 (0 in 5+ unit buildings).
- Camden County population projected at +5% by 2050 — modest demand growth; plan on rents tracking national, not racing it.
- 3 sale attempts with the ask held roughly flat each time — persistent listings suggest the price (not the market) is what's stuck; bring a comps-based counter.
Questions for listing agent
- What do current leases actually rent for vs. the listed asking? Can we see a recent rent roll and the last 12 months of T-12 income?
- What does the HOA fee cover, when was the last increase, and are there any pending special assessments or reserve-fund shortfalls?
- Is there a deadline driving the sale (1031 exchange, divorce, estate, relocation)? That informs how much negotiation room exists.
- Schools are D-rated, which usually means shorter tenancies and higher turnover. Who's the typical renter profile here, and what's been the actual vacancy rate?
- The area grade is low — what's the realistic commute time and amenity access for the typical tenant pool here? Any planned neighborhood developments (good or bad) we should know about?
- What's the average days-on-market for RENTAL listings here right now (not sales)? A rising rental-DOM trend means longer vacancies and softer asking-rent achievability than the comps imply.
- What's the recent tenant-quality profile in this submarket — average credit score on applications, eviction rate, late-payment / NSF rate, and stable-employment percentage? A property-management company in the area should have these aggregated.
- How much new for-sale + rental construction is in the pipeline within 1–3 miles? Heavy new supply typically softens prices + rents 12–24 months out; constrained supply supports both.
CashFlowRE · CFR-ZDXTEX97M8Z475
· Data 2 weeks ago
cashflowre.app · 2026-05-29