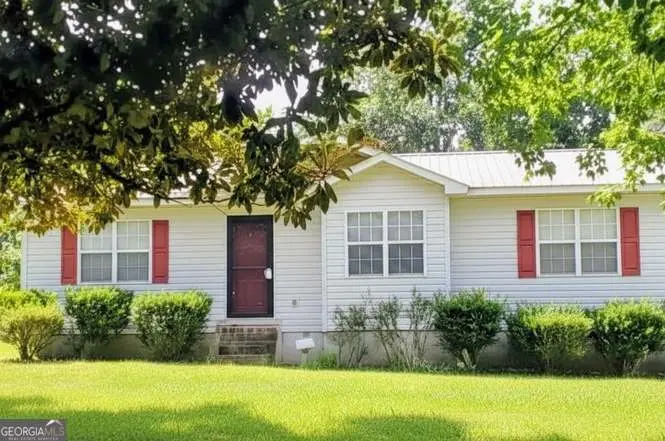
2304 Cummings Rd
Fort Valley, GA 31030
$154,500D
3 bd · 1.5 ba ·
1,064 sqft ·
Built 1991
· SingleFamily
· Active
· 60 DOM
Cashflow @ list (25.0% down · 7.5%)
Estimated rent
$1,355/mo
Mortgage (P&I)
−$810
Tax + insurance
−$177
HOA
−$0
Vac / Maint / Mgmt
−$285
Net cashflow
$84/mo
Annual
$1,003/yr
Cap rate
6.94%
Cash-on-cash
2.32%
DSCR
1.10
1% rule
0.88%
Cash to close
$43,260
Investor read
- This is a 3-bed/1.5-bath single-family listed at $154k.
- At list price, monthly cash flow is $84 ($1k/yr) — positive.
- The deal already cash-flows at list — no discount required.
- To meet the 1% rule (rent ≥ 1% of price), the offer needs to be $136k (12.3% below list).
- It's been on market 60 days — a 3% lower offer ($150k) is reasonable based on typical stale-listing flexibility.
- Recommended offer: $136k (12.3% below list) — sets the bar for 1% rule.
- Local home prices are declining (-3.0%/yr); year-one equity from $1k of loan paydown is wiped out by about $5k of value loss. Plan a longer hold.
- Location reads 65/100 on livability (#220 in GA) — a middle-class / working-renter tenant base. Strengths: cost of living A+, health & safety A+, housing A-; Watch: crime D+, schools F, amenities F.
- Crawford County (rural): math 20% / reading 29% proficiency, ranked #127 of 174 in GA (top 73%) — low school quality limits family demand, transient renter base, plan for 1-2y turnover; 70% free/reduced lunch — lower-income household profile, screen leases tightly.
- Market conditions: 116 active listings in the ZIP; 43 units permitted in Crawford County in 2024 (0 in 5+ unit buildings).
- Crawford County population projected at -22% by 2050 — secular population decline; favor cash flow + early exit over multi-decade hold.
- 5 sale attempts since 2y ago with the ask held roughly flat each time — persistent listings suggest the price (not the market) is what's stuck; bring a comps-based counter.
- Current owner paid $80k; list at $154k implies a 93% gain — meaningful room to come down on a strong offer.
- Climate carrying-cost: major wind risk, 67% chance of damaging wind over 30y; extreme-heat days projected 7→18/yr by 2055 (HVAC capex compounding) — expect insurance premiums to compound above CPI over the hold.
- Cap rate 6.9% vs local median 5.7% in Fort Valley — meaningfully above typical; check what's discounted (condition, days-on-market, listing class) to confirm the premium yield is real.
Questions for listing agent
- It's been on market 60 days. Have you received any prior offers? Is the seller open to a 12% concession, seller financing, or rate buy-down credit?
- Is there a deadline driving the sale (1031 exchange, divorce, estate, relocation)? That informs how much negotiation room exists.
- Schools are F-rated, which usually means shorter tenancies and higher turnover. Who's the typical renter profile here, and what's been the actual vacancy rate?
- Crime grade is D in this area — have there been break-ins, vandalism, or insurance claims at this property in the last 3 years? What carrier currently insures it and at what premium?
- The area grade is low — what's the realistic commute time and amenity access for the typical tenant pool here? Any planned neighborhood developments (good or bad) we should know about?
- What's the average days-on-market for RENTAL listings here right now (not sales)? A rising rental-DOM trend means longer vacancies and softer asking-rent achievability than the comps imply.
- What's the recent tenant-quality profile in this submarket — average credit score on applications, eviction rate, late-payment / NSF rate, and stable-employment percentage? A property-management company in the area should have these aggregated.
- How much new for-sale + rental construction is in the pipeline within 1–3 miles? Heavy new supply typically softens prices + rents 12–24 months out; constrained supply supports both.
CashFlowRE · CFR-ZGWD8TAPBWVMCT
· Data 1 week ago
cashflowre.app · 2026-05-29