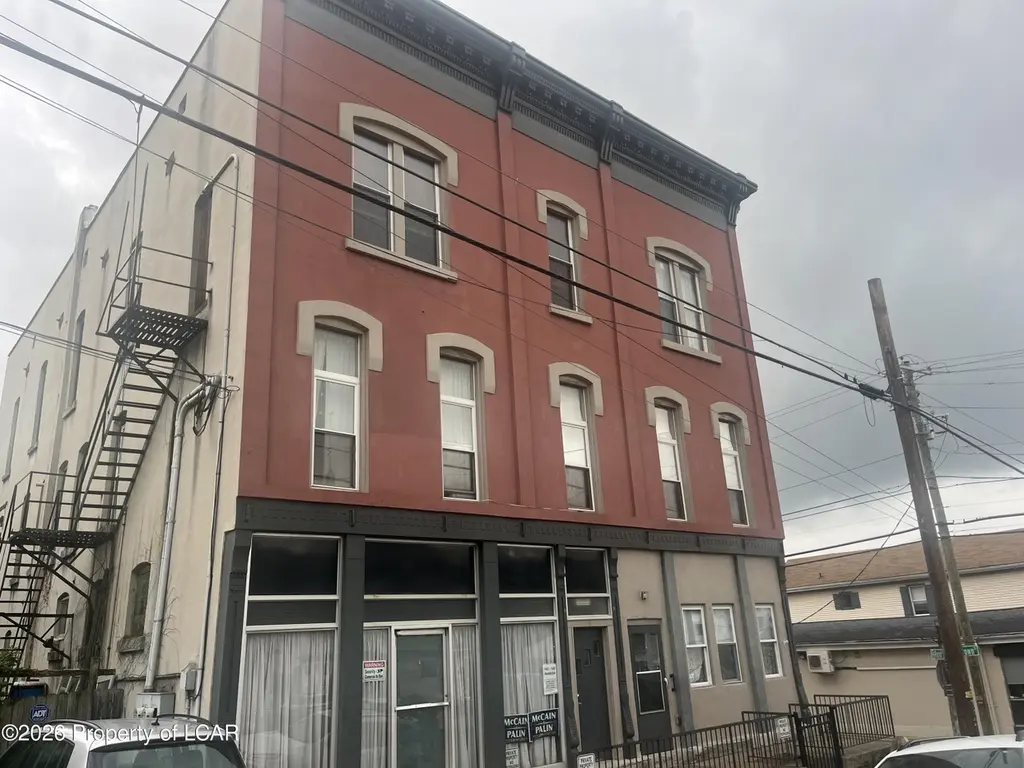
143-145 Parrish St
Wilkes-Barre, PA 18702
$350,000C-
8 bd · 5.0 ba ·
8,400 sqft ·
Built —
· MultiFamily
· Pending
· 6 DOM
Cashflow @ list (25.0% down · 7.5%)
Estimated rent
$3,406/mo
Mortgage (P&I)
−$1,835
Tax + insurance
−$583
HOA
−$0
Vac / Maint / Mgmt
−$715
Net cashflow
$272/mo
Annual
$3,264/yr
Cap rate
7.23%
Cash-on-cash
3.33%
DSCR
1.15
1% rule
0.97%
Cash to close
$98,000
Investor read
- This is a 2 × 4-bed/2.5-bath units multifamily listed at $350k. Condition is rated fair.
- At list price, monthly cash flow is $272 ($3k/yr) — positive. Per door: $136/mo.
- The deal already cash-flows at list — no discount required.
- To meet the 1% rule (rent ≥ 1% of price), the offer needs to be $341k (2.7% below list).
- Only 6 days on market — expect competitive offers; lowballing is unlikely to land.
- Recommended offer: $341k (2.7% below list) — sets the bar for 1% rule.
- Local home prices are declining (-3.0%/yr); year-one equity from $2k of loan paydown is wiped out by about $10k of value loss. Plan a longer hold.
- Location reads: area grade C — affects rentability + tenant quality, not the cash-flow math above.
- Wilkes-Barre Area SD (urban): math 19% / reading 32% proficiency, ranked #469 of 539 in PA (top 87%) — low school quality limits family demand, transient renter base, plan for 1-2y turnover; 61% free/reduced lunch — lower-income household profile, screen leases tightly.
- Zoned schools: Dodson El Sch (math 2% / reading 22%, grade F, #1,362 of 1,518 statewide, top 92%, 486 students, 100% FRL); G A R Ms (math 17% / reading 22%, grade F, #444 of 512 statewide, top 87%, 1,026 students, 100% FRL) — zoned schools average 100% FRL vs 61% district-wide (39 pts higher); higher-poverty schools than district average — tighter screening recommended.
- Market conditions: Rents rising fast (+6.8%/yr); 225 active listings in the ZIP; 349 units permitted in Luzerne County in 2024 (16 in 5+ unit buildings).
- Luzerne County population projected at +4% by 2050 — modest demand growth; plan on rents tracking national, not racing it.
- Cap rate 7.2% vs local median 5.6% in Wilkes-Barre — meaningfully above typical; check what's discounted (condition, days-on-market, listing class) to confirm the premium yield is real.
- At $3,406/mo this rent would consume 72% of the median local household income ($56k/yr) (locally 1632% of renters already pay >50% of income on rent) — very limited rent-growth headroom before tenants either downsize or default.
Questions for listing agent
- Can we see the unit-by-unit rent roll, current vacancy, and any below-market leases? What's the average tenancy length?
- What capital expenditures (roof, boiler, parking lot, exteriors) have been made in the last 5 years, and what's planned in the next 2?
- Have any recent inspections been done? Can we get a copy of the seller's disclosures and any deferred-maintenance estimates?
- Is there a deadline driving the sale (1031 exchange, divorce, estate, relocation)? That informs how much negotiation room exists.
- What's the average days-on-market for RENTAL listings here right now (not sales)? A rising rental-DOM trend means longer vacancies and softer asking-rent achievability than the comps imply.
- What's the recent tenant-quality profile in this submarket — average credit score on applications, eviction rate, late-payment / NSF rate, and stable-employment percentage? A property-management company in the area should have these aggregated.
- How much new apartment / multifamily construction is in the pipeline within 1–3 miles? Heavy new supply (>2% of stock underway) typically softens rents 12–24 months out; light construction supports rent growth.
Repairs flagged (vision-AI assessment)
- Major: exterior paint — Peeling paint
- Major: interior paint — Signs of wear
- Major: kitchen appliances — Outdated and cluttered
- Major: bathroom fixtures — Basic and outdated
- Major: flooring — Worn-out carpets
- Major: HVAC cleaning — Needs cleaning and maintenance
CashFlowRE · CFR-ZKN0S27C1J7E5C
· Data 1 week ago
cashflowre.app · 2026-05-29